Hi:
In v3.60 ,I use BasePointMarker to create what I need(fig 1). Second row test count is follow the points’ Y-Axis value 1~1000.
But in SciChart v4.0, “Draw(IRenderContext2D context, IEnumerable centers)” replace “DrawInternal(IRenderContext2D context, double x, double y, IPen2D pen, IBrush2D brush)”. The “double x, double y” disappear ,I can not get the Y value to implement count. There is other problem. In V3.60 , VisibleRange change cause pointmarker redraw. In V4.0 VisibleRange change cause nothing.(fig 2).
V3.60 code
protected override void DrawInternal(IRenderContext2D context, double x, double y, IPen2D pen, IBrush2D brush)
    {

        var dataValue = XAIS.GetDataValue(y);
        int Y_VALUE = (int)Math.Round((Double)dataValue) + 1;
        context.DrawText(new Rect(x - 20, 0, 50, 20), brush.Color, 12, TimeSet.ToString() + "/" + Period.ToString());
        context.DrawText(new Rect(x - 10, 16, 25, 20), brush.Color, 12, Y_VALUE.ToString());
        context.DrawText(new Rect(x - 10, 30, 30, 20), Color.FromScRgb(255, 255, 255, 255), 12, (Addr + Y_VALUE).ToString());
    }
V4.0 code
public override void Draw(IRenderContext2D context, IEnumerable<Point> centers)
    {
        var fill = context.CreateBrush(Fill);
        var stroke = context.CreatePen(Stroke, AntiAliasing, (float)StrokeThickness);

        float width2 = (float)(Width * 0.5);
        float height2 = (float)(Height * 0.5);
        foreach (var center in centers)
        {
            var dataValue = AXIS.GetDataValue(center.Y);
            int Y_VALUE = (int)Math.Round((Double)dataValue) + 1;
            context.DrawText(new Rect(center.X - 20, 0, 50, 20), fill.Color, 12, TimeSet.ToString() + "/" + Period.ToString());
            context.DrawText(new Rect(center.X - 10, 16, 25, 20), fill.Color, 12, Y_VALUE.ToString());
            context.DrawText(new Rect(center.X - 10, 30, 30, 20), Color.FromScRgb(255, 255, 255, 255), 12, (Addr + Y_VALUE).ToString());
        }
    }
Best regards,
Xuan


- JiaRong Kang asked 8 years ago
- last edited 8 years ago
- You must login to post comments
We’ve already answered this by email, but for other users, here is the answer
What you want to do looks pretty complex, but I have an idea for you.
If you take a look at our SciChart WPF v4 Examples, Series with Metadata example, you can see how we’ve created custom point markers with additional Info from our PointMetadata API.
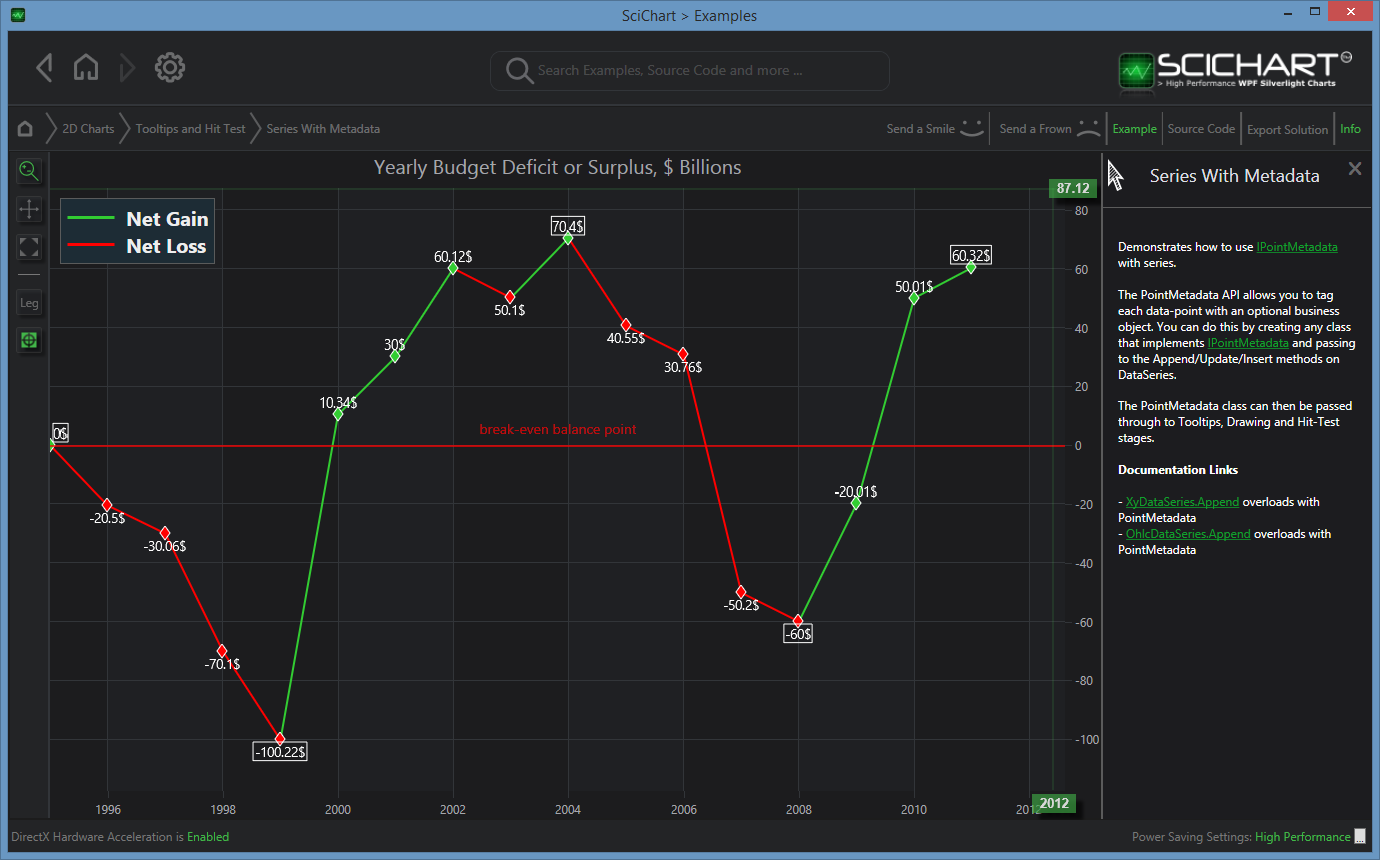
Take a look at the source for AnnotatedPointMarker.cs in the example
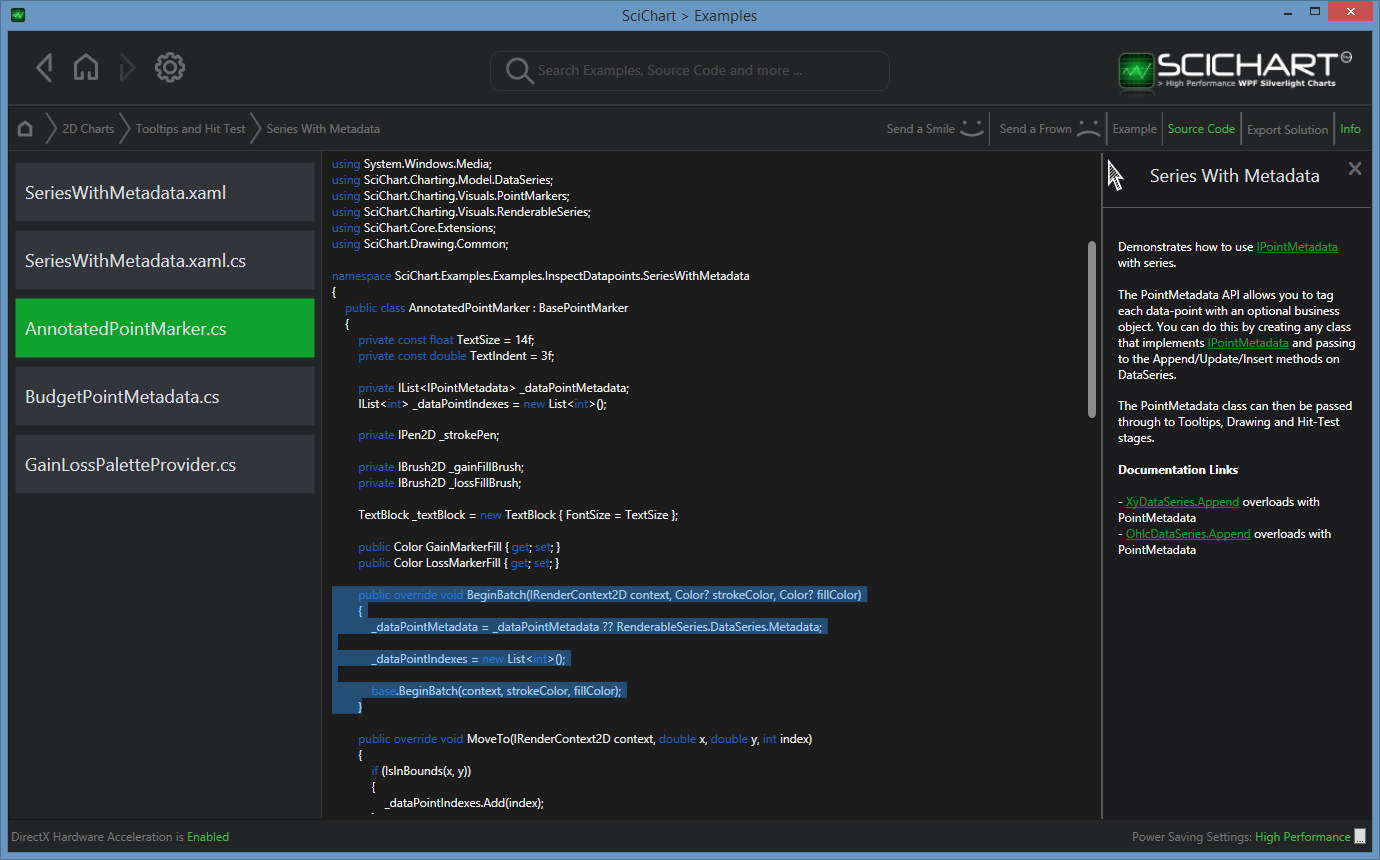
This stores actual data-values for later use in drawing. It is also a cool example of our new PointMetadata API!
Want to try it out?
Best regards,
Andrew
- Andrew Burnett-Thompson answered 8 years ago
- You must login to post comments
Please login first to submit.
