Hello Joerg,
Axis Label styling was introduced in SciChart v3.0. You can now set a Style for a label including margins, LayoutTransforms etc…
Please see the answer on Styling Axis Labels for more information.
Best regards,
Yuriy
- Yuriy Zadereckiy answered 12 years ago
Sure, you can either use a TextAnnotation for an axis label on top of the axis. Just give the position for the Y axis, 0, yaxisMax + font height. You can also use regular Labels on top of the graph if you want to do that. I think you can also make your own custom NumericAxis to be able to do this.
The second part is easier, just make two textboxes and bind them to a property called YAxisMin YAxisMax, XAxisMin, XAxisMax. You can also bind them to your axis like this.
xAxis.SetBinding(NumericAxis.MinRange, new Binding(“XAxisMin”));
good luck.
- kewur answered 9 years ago
Hello Joerg,
As part of SciChart v3.0 all axis types now show labels at VisibleRange.Max and Min, so long as VisibleRange.Max, Min fall at ‘nice’ values, e.g. 1.0, 1.5, 2.0, 2.5 etc… By default the chart will choose these nice values when first showing or autoranging.
When you scroll however, the labels scroll too – you lose the labels at the edges of the axis. In this case you might want to use our new StaticAxis Feature, which fixes axis labels at fixed intervals and updates the label value instead.
Best regards,
Yuriy
- Yuriy Zadereckiy answered 12 years ago
- last active 8 years ago
Hi George,
This is a problem we’re trying to solve (MVVM in general) and there’s no good answer at the moment! Just a note, there may be some changes in the SeriesSource API in the next major release (quite a while off though) to make this easier.
The problem is we need to separate view & viewmodel, yet retain control over series-type, colors, point-markers from the viewmodel which are much better defined in the XAML.
If you wanted to apply the same RolloverMarker to all series, you could use an unnamed style, e.g.
<!-- Define in UserControl.Resources, or Application resources, with no key -->
<Style TargetType="{x:Type SciChart:FastLineRenderableSeries}">
            <Setter Property="RolloverMarkerTemplate">
                <Setter.Value>
                    <ControlTemplate>
                        <Ellipse Width="7" Height="7" Fill="SlateGray" Stroke="SlateGray" StrokeThickness="1" />
                    </ControlTemplate>
                </Setter.Value>
            </Setter>
        </Style>
This will apply the same Rollover Marker to all FastLineRenderableSeries’ in that scope.
Perhaps another solution is to define a ResourceDictionary which contains your styles (this time keyed) and set them using an attached property? E.g. if a resource dictionary was added to the App.xaml you can retrieve styles and templates from it by calling Application.Current.Resources[“key”]. Rather than getting application resources in your viewmodel sometime’s it’s better to define a property in your viewmodel of type string, and use attached properties to apply the style.
For example:
        <!-- TODO: ControlTemplates can be defined in resource dictionaries and added to App.Xaml -->
        <ControlTemplate x:Key="GrayMarkerTemplate">
            <Ellipse Width="7" Height="7" Fill="SlateGray" Stroke="SlateGray" StrokeThickness="1" />
        </ControlTemplate>

        <ControlTemplate x:Key="BlueMarkerTemplate">
            <Ellipse Width="7" Height="7" Fill="SteelBlue" Stroke="SteelBlue" StrokeThickness="1" />
        </ControlTemplate>
// Create attached properties and attached behaviours to assist and work around MVVM's limitations
public class RolloverMarkerHelper : DependencyObject
    {
        public static readonly DependencyProperty RolloverTemplateKeyProperty =
            DependencyProperty.RegisterAttached("StyleKey", typeof (string), typeof (RolloverMarkerHelper), new PropertyMetadata(default(string), OnRolloverTemplateKeyChanged));

        public static void SetRolloverTemplateKey(UIElement element, string value)
        {
            element.SetValue(RolloverTemplateKeyProperty, value);
        }

        public static string GetRolloverTemplateKey(UIElement element)
        {
            return (string) element.GetValue(RolloverTemplateKeyProperty);
        }

        private static void OnRolloverTemplateKeyChanged(DependencyObject d, DependencyPropertyChangedEventArgs e)
        {
            var element = d as BaseRenderableSeries;

            if (element == null)
                return;

            if (e.NewValue == null)
            {
                element.RolloverMarkerTemplate = null;
                return;
            }

            if (Application.Current != null)
            {
                var resource = Application.Current.TryFindResource(e.NewValue) as ControlTemplate;
                element.RolloverMarkerTemplate = resource;
            }
        }
    }
Then the template can be applied like this
            _chartSeries = new ObservableCollection<IChartSeriesViewModel>();

            var rSeries0 = new FastLineRenderableSeries();
            RolloverMarkerHelper.SetRolloverTemplateKey(rSeries0, "GrayMarkerTemplate");
            _chartSeries.Add(new ChartSeriesViewModel(ds0, rSeries0));

            var rSeries1 = new FastLineRenderableSeries();
            RolloverMarkerHelper.SetRolloverTemplateKey(rSeries1, "BlueMarkerTemplate");
            _chartSeries.Add(new ChartSeriesViewModel(ds1, rSeries1));
I’ve attached a full example to this post. It’s not the most elegant of solutions but it does show how you can work around some of these issues by using attached properties or attached behaviours.
Hope this helps!
Andrew
- Andrew Burnett-Thompson answered 11 years ago
Got it working! I ended up using some different code to get the job done, which I’ll share here:
        // Custom mouse wheel usage
        public override void OnModifierMouseWheel(ModifierMouseArgs e)
        {
            // Get region of axis
            Rect XAxisBounds = XAxis.GetBoundsRelativeTo(RootGrid);
            Rect YAxisBounds = YAxis.GetBoundsRelativeTo(RootGrid);

            // Only zoom in that axis if mouse over axis
            if      (XAxisBounds.Contains(e.MousePoint))
            {
                // If zooming in
                if      (e.Delta > 0)
                    XAxis.ZoomBy(-0.1, -0.1);
                // If zooming out
                else if (e.Delta < 0)
                    XAxis.ZoomBy( 0.1,  0.1);

                // Now don't do anything else
                e.Handled = true;
                return;
            }
            else if (YAxisBounds.Contains(e.MousePoint))
            {
                if      (e.Delta > 0)
                    YAxis.ZoomBy(-0.1, -0.1);
                else if (e.Delta < 0)
                    YAxis.ZoomBy( 0.1,  0.1);

                e.Handled = true;
                return;
            }

            // Otherwise, operate normally
            base.OnModifierMouseWheel(e);
        }
Your initial points and several key methods helped out a lot! I also simplified some parts I didn’t need. Thanks!
- boss1000 answered 11 years ago
I am considering applying server-side licensing for my javerScript application.
In the document below, there is a phrase “Our server-side licensing component is written in C++.”
(https://support-dev.scichart.com/index.php?/Knowledgebase/Article/View/17256/42/)
However, there is only asp.net sample code on the provided github.
(https://github.com/ABTSoftware/SciChart.JS.Examples/tree/master/Sandbox/demo-dotnet-server-licensing)
I wonder if there is a sample code implemented in C++ for server-side licensing.
Can you provide c++ sample code?
Also, are there any examples to run on Ubuntu?
- hhd2002 answered 10 years ago
Hi Egbert,
We have added the ability to show Min Max ticks on an axis, as well as many other axis enhancements such as the TickProvider API in v3.0 of SciChart. Please see this related post on CategoryDateTimeAxis Grid Lines.
Using the TickProvider API
In SciChart v3.0 and above, there is now a way to override the exact Tick Intervals.
See this KB article on Advanced Tick Frequency Overriding which introduces the TickProvider API. This allows exact calculation of ticks (Axis Major, Minor gridlines and labels) as the axis is drawn.
Best regards,
Andrew
- Andrew Burnett-Thompson answered 10 years ago
Update: June 2014
We have gone through all the tutorials on Screenshots, Printing to XPS, Export to Bitmap and updated them. Please see the updated links below below.
- Export chart from screen to bitmap
- Exporting chart with legend to bitmap
- Rendering chart to bitmap in memory
- Screenshots, XPS Printing, X-Axis Text Labels
The Screenshots, XPS Printing, X-Axis Text Labels article now has an updated sample which compiles against SciChart v3.0 so you can download it and get started.
Hope this helps!
Andrew
- Andrew Burnett-Thompson answered 10 years ago
Hi,
Seems like you are trying to take a screenshot without rendering just like me. I have asked a question about it here: https://www.scichart.com/questions/question/taking-a-screenshot-of-the-graph-after-launch-does-not-display-the-data-points
you can download the sample project and see how you can do this. You need to give it a size, measure and arrange the chart and call UpdateLayout.
hope this helps.
kewur
- kewur answered 9 years ago
Hello there,
The Annotations feature in v1.5 uses UIElements. These are very flexible (as they are WPF elements) but are also very slow compared to the bitmap rendering that we employ in SciChart.
We did have a user once who added 50,000 annotations to a WPF SciChart. It did take a few seconds to redraw but it did perform. We got his performance down from minutes (like you) to a few seconds by using the following code:
      using (sciChartSurface.SuspendUpdates())
      {
        // Create temporary AnnotationCollection
        var myAnnotations = new AnnotationCollection();

        double minx = double.MaxValue;
        double maxx = double.MinValue;

        foreach (var c in cmdList)
        {
          if (c.X < minx) minx = c.X;
          if (c.X > maxx) maxx = c.X;

          var a = new BoxAnnotation
          {
            // Assign X1,Y1, Background etc...
          };

           myAnnotations.Add(a);
        }

        // Reassign annotation collection
        sciChartSurface.Annotations = myAnnotations;

        sciChartSurface.ZoomExtents();
      }
Assigning the annotation collection in one go will prevent internal updates/redraws occurring on each add. Please try this and let me know if it helps.
Thanks!
Andrew
- Andrew Burnett-Thompson answered 11 years ago
Hello lovely SciChart people,
An update for you. SciChart v3.0 now supports templating of Axis Titles natively. Please see the SciChart v3.0 Release Notes.
5. Axis Styling improvements
- Chart Titles, Axis Titles and Labels can now be styled
- Can set font size, font style, font weight on Axis labels
- Now supports optional rotation of axis tick labels (e.g. 90 degrees)
Usage:
<!-- Styling Tick Labels with rotation and custom font-size and foreground -->
<s:DateTimeAxis>
<s:DateTimeAxis.TickLabelStyle>
<Style TargetType="s:DefaultTickLabel">
<Setter Property="Foreground" Value="Blue" />
<Setter Property="FontSize" Value="25" />
<Setter Property="LayoutTransform">
<Setter.Value>
<RotateTransform Angle="45" />
</Setter.Value>
</Setter>
</Style>
</s:DateTimeAxis.TickLabelStyle>
</s:DateTimeAxis>
</pre>
<!-- Styling Numeric Axis Tick Labels -->
<s:NumericAxis>
<s:NumericAxis.TickLabelStyle>
<Style TargetType="s:NumericTickLabel">
<Setter Property="Foreground" Value="Blue" />
<Setter Property="FontSize" Value="25" />
</Style>
</s:NumericAxis.TickLabelStyle>
</s:NumericAxis>
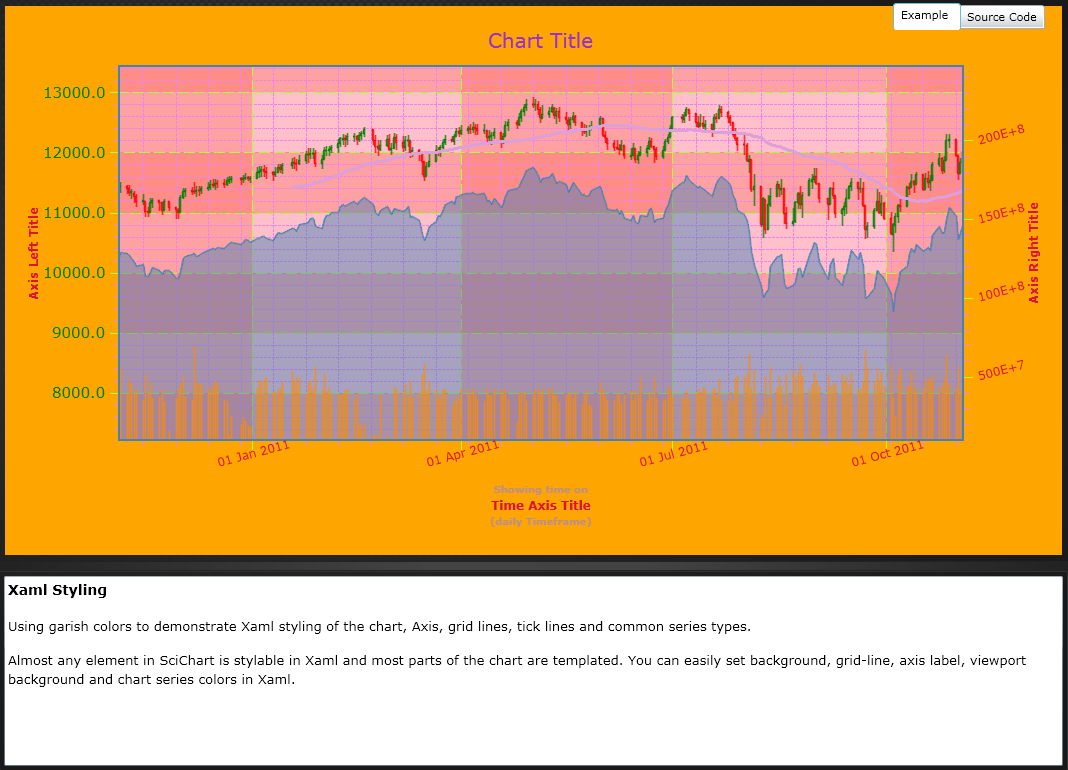
<!-- Declare an Axis Title Template -->
<Style x:Key="BottomAxisTitleStyle" TargetType="s:AxisTitle">
<Setter Property="ContentTemplate">
<Setter.Value>
<DataTemplate>
<StackPanel>
<TextBlock Margin="0,3,0,0"
Style="{StaticResource TitleTextStyle}"
Text="Showing time on"/>
<TextBlock HorizontalAlignment="Center"
VerticalAlignment="Center"
Text="{Binding}" />
<TextBlock Margin="0,0,0,3"
Style="{StaticResource TitleTextStyle}"
Text="(daily Timeframe)"/>
</StackPanel>
</DataTemplate>
</Setter.Value>
</Setter>
</Style>
<!-- Apply an Axis Title Template -->
<s:DateTimeAxis AxisTitle="Time Axis Title" TitleStyle="{StaticResource BottomAxisTitleStyle}" Style="{StaticResource AxisStyle}"/>
<!-- Apply an Axis Title Template -->
<s:DateTimeAxis AxisTitle="Time Axis Title" TitleStyle="{StaticResource BottomAxisTitleStyle}" Style="{StaticResource AxisStyle}"/>
Also the XAML Styling application demonstrates this.
Best regards,
Andrew
- Andrew Burnett-Thompson answered 10 years ago
- last active 10 years ago
Hi Miles,
This is because all mouse clicks are relative to the parent SciChartsurface. If you want to get the coordinates relative to the ModifierSurface itself, you have to perform a simple translation operation.
public override void OnModifierMouseMove(ModifierMouseArgs e)
{
   // gets the bounds of the ModifierSurface with respect to the RootGrid
   // which hosts the SciChartSurface
   var modifierRect = ModifierSurface.GetBoundsRelativeTo(RootGrid);

   // Translates the mouse point (from root grid coords) to ModifierSurface coords
   var mousePoint = base.GetPointRelativeTo(e.MousePoint, ModifierSurface);
}
Can you try the above translation and let me know if it works?
- Andrew Burnett-Thompson answered 12 years ago
Hello there,
Please find a short example attached which re-creates this chart Updated for SciChart v3.1
- The Histogram is created by using FastColumnRenderableSeries and DataPointWidth=1.0
- The labels are created by using the TextAnnotation)
- The legend is created by using the LegendModifier (as source) and SciChartLegend as consumer
Best regards,
Andrew
- Andrew Burnett-Thompson answered 11 years ago
- last active 10 years ago
Hi Joerg,
Sounds like what you need is annotations! We have a rich annotations API as of SciChart v1.5, you can see this article which demonstrates how to use it:
Also there is an MVVM sample that does the same thing in the demo app here:
Drag Horizontal Threshold Example
Now if you were to set up something like this:
- A SciChartSurface with two HorizontalLineAnnotations and two VerticalLineAnnotations
- A ViewModel with X1, X2, Y1, Y2 properties, type double. All properties should implement PropertyChanged
- Bind each HorizontalLineAnnotation.X1 to each X property in the ViewModel
- Bind each VerticalLineAnnotation.Y1 to each Y property in the ViewModel
When the user drags the mouse on an annotation you will be notified in the setter of the property in your view model. Likewise you can set the view model properties and the annotation positions will update.
Let me know if that helps,
- Andrew Burnett-Thompson answered 12 years ago
Hello there,
As of SciChart v2.0 this is now possible. ScIChart supports unlimited X or Y Axes on the left, top, right, bottom of the chart. You can use this feature to place XAxis on the Left and YAxis on the Top as per our Vertical Charts Example.

Best regards,
Yuriy
- Yuriy Zadereckiy answered 12 years ago
- last active 8 years ago
I have no idea. It sounds like a similar error VS puts out (in English) – the type X cannot be found in the namespace Y.
Typically when I’ve seen this its been a badly resolved reference, e.g. you have two DLLs of different versions referenced by different projects, or, you have recently upgraded the DLL version and Visual Studio has not cleared its cache.
Try restarting Visual Studio, deleting all Bin/Obj directories and doing a clean re-build. Does it work?
If not, try creating a blank project and start including these classes. Can Visual Studio see them?
Andrew
- Andrew Burnett-Thompson answered 10 years ago
Hi Danila,
Please take a look on this thread – Correlating metadata with datapoints. It shows several possible approaches to add additional information for data points in your series.
Hope it helps!
- Yura Khariton answered 9 years ago
- last active 9 years ago
Hello Ian,
I’m cleaning the threads and found your solution to bind the Overview to the first SciChartSurface inside an ItemsControl
Hi Andrew
In the end I looked at this problem from a completely different angle and came up with this solution.
This is the full SciChartOverviewExtension code.
Thanks & Regards
Ian
SciChartOverviewExtension Source Code
public class SciChartOverviewExtensions
{
    public static readonly DependencyProperty ItemsControlParentSurfaceProperty =
        DependencyProperty.RegisterAttached("ItemsControlParentSurface",
        typeof(ItemsControl),
        typeof(SciChartOverviewExtensions),
        new PropertyMetadata(default(ItemsControl), OnItemsControlPropertyChanged));

    public static void SetItemsControlParentSurface(UIElement element, ItemsControl value)
    {
        element.SetValue(ItemsControlParentSurfaceProperty, value);
    }

    public static ItemsControl GetItemsControlParentSurface(UIElement element)
    {
        return (ItemsControl)element.GetValue(ItemsControlParentSurfaceProperty);
    }

    private static void OnItemsControlPropertyChanged(DependencyObject d, DependencyPropertyChangedEventArgs e)
    {
        var overview = (SciChartOverview)d;
        var itemsControl = e.NewValue as ItemsControl;
        if (itemsControl == null)
        {
            overview.ParentSurface = null;
            return;
        }

        itemsControl.ItemContainerGenerator.StatusChanged += (_, __) =>
        {
            if (itemsControl.ItemContainerGenerator.Status != GeneratorStatus.ContainersGenerated) return;

            var item0Element = itemsControl.ItemContainerGenerator.ContainerFromIndex(0) as FrameworkElement;
            if (item0Element == null)
            {
                overview.ParentSurface = null;
                return;
            }

            item0Element.Loaded += (s, a) =>
            {
                var sciChartSurfaceOnLoad = item0Element.FindChild<SciChartSurface>();

                overview.ParentSurface = sciChartSurfaceOnLoad;

                overview.ParentSurface.RenderableSeries.CollectionChanged += (o, args) =>
                {
                    if (args.Action == NotifyCollectionChangedAction.Add)
                        overview.DataSeries = overview.ParentSurface.RenderableSeries[0].DataSeries;

                };
            };

        };
    }
}
Usage:
<ItemsControl x:Name="ItemsControl" ItemSource="{Binding ViewModelList}">
    <ItemsControl.ItemTemplate>
    </ItemsControl.ItemTemplate>
</ItemsControl>

<SciChartOverview local:SciChartOverviewExtensions.ItemsControlParentSurface="{Binding ElementName=ItemsControl}"/>
UPDATE v3.2
The above solution will only work with ItemsControl in WPF. It will not work with the SciChartGroup. To add an Overview in the SciChartGroup we have created an FAQ titled How to add a SciChartOverview to a SciChartGroup using the ScrollBar API in v3.2
Hope this helps!
Andrew
- Andrew Burnett-Thompson answered 10 years ago
- last active 9 years ago
Hi Jonny,
Try testing Keyboard.Modifiers instead of e.Modifier to see if the CTRL key is pressed.
Then, try setting ExecuteOn=MouseLeftButton for the RubberBandXyZoomModifier.
Like this:
public class RubberBandXyZoomModifierEx : RubberBandXyZoomModifier
{
    public override void OnModifierMouseDown(ModifierMouseArgs e)
    {
        IsXAxisOnly = !e.IsMaster;

        if (!(Keyboard.Modifiers == ModifierKeys.Control))
        {
            base.OnModifierMouseDown(e);
        }
    }
}

public class ZoomPanModifierEx : ZoomPanModifier
{
    public override void OnModifierMouseDown(ModifierMouseArgs e)
    {
        if ((e.MouseButtons == MouseButtons.Left) && (Keyboard.Modifiers == ModifierKeys.Control))
        {
            base.OnModifierMouseDown(e);
        }
    }
}
Hope this helps!
Andrew
- Andrew Burnett-Thompson answered 11 years ago
Thanks for the pointers. They were enough to get me traveling in the right direction with this one.
The issue was the FindAncestor binding. However, rather than having to manage the changes down at the Data Template ViewModel level I found a very nice technique for passing the correct DataContext in the XAML. Here is is…
- Create a Binding Proxy
    public class BindingProxy : Freezable
    {
        protected override Freezable CreateInstanceCore()
        {
            return new BindingProxy();
        }

        public object Data
        {
            get { return GetValue(DataProperty); }
            set { SetValue(DataProperty, value); }
        }

        // Using a DependencyProperty as the backing store for Data.
        // This enables animation, styling, binding, etc...
        public static readonly DependencyProperty DataProperty =
            DependencyProperty.Register("Data", typeof(object),
            typeof(BindingProxy), new UIPropertyMetadata(null));
    }
- Declare it in the XAML and Bind its Data property to the context you need to reference
<uiServices:BindingProxy x:Key="BindingProxy" Data="{Binding}"/>
- Use it to replace the FindAncestor binding
<visuals:RolloverModifier IsEnabled="{Binding Path=Data.ChartModifier, Source={StaticResource BindingProxy}, Converter={StaticResource IsModifierTypeConverter}, ConverterParameter=Rollover, Mode=TwoWay }"
Hope this helps someone else.
Regards
Ian
- Ian Carson answered 10 years ago
