Hello,
As you have already the examples of the EEG -50 channel, Is it possible to set the sensitivity factor for the channels to show the graph.
Basically, this will set the amplitude based on the frequency variation example 7micro volts/millimeter (7microvolts/mm) for each channel. Is there any way we can do it using Scichart, please let us know.
Appreciate your help
Regards,
Aditya
- Aditya Kadambi asked 3 years ago
- last active 3 years ago
Hi
Is there a way to just change the values of the pie segments so it get updated on the donut chart.
If I remove and add the pie segments again it works, is this the correct way?
Also I can’t find any documentation around the donut for android/xamarin
regards
Per
- robin grönlund asked 6 years ago
- last active 6 years ago
Hi
I have come across that Android Scichart consuming a lot of memory while drawing it on the surface. It increase more with the time. When i run the android memory profiler, i find out 60-65 % memory consumed by the Graphics only. The app getting started hangs after some time and become unresponsive. Please let me know how to improve the memory utilization.
- Developer Mt asked 6 years ago
- last active 6 years ago
This is what I want it to look like: (see 1.jpg)
This is what (see 2.jpg) it does look like if I leave setIsLabelCullingEnabled enabled (all labels are culled except if I zoom WAY in)
This is what (see 3.jpg) it does look like if I turn off setIsLabelCullingEnabled
I would expect #2 to look like #3 without either one of the 20/15% and either 1% or 1.25% culled, when culling is enabled.
First things the specific values/locations are precise, I need those lines and labels exactly where they are. So I had to create my own LogarithmicNumericTickProvider and feed it all the numbers; this worked great and the numbers are where they need to be — but apparently using our own LogarithmicNumericTickProvider totally breaks culling. Any ideas on how we can get culling to work with our own LogarithmicNumericTickProvider. Is their another way to do this without using our own LogarithmicNumericTickProvider.
- Nathanael Anderson asked 4 years ago
- last active 4 years ago
Dear Support, I have SciChartSurface in fragment (Xamarin Android). I added Xaxis (DateAxis), Yaxis (NumericAxis), standard modifiers and few XyDataSeries as FastLineRenderableSeries. Everything is working fine (screenshot 1). But something strange is happen when fragment with chart is Paused -> Stopped and then Started -> Resumed. Xaxis and Yaxis are not visible. All dataseries are not visible. But I debugged and all data is there. Even rolloverModifier is still working and correct data values are displayed in labels (screenshot 2). It does not happen every time – it depends on what external intent stopped fragment.
I’ve tried reinitialize chart (clear Xaxis, Yaxis, remove modifiers, remove renderableSeries are reinit all with new variables) and it does not help. Only fragment dettach -> attach helps or screen orientantion change (it reinitializes fragment)
Could you tell me any suggestion what can I check or how to force to redraw whole SciChartSurface? (hiding it and showing it does not help – effect is the same. Only fragment dettach and attach helps (this is my workaround at the moment).
- Artur Kowalczuk asked 5 years ago
- last active 5 years ago
Hi !
Is it possible to display the RollOverModifier tooltip on the real points only ? Say I have points (1 1) and (3 3) in my chart and I don’t wan’t the tooltip to display (1.5 1.5), (2 2), (2.5 2.5) etc. when rolling over… Any idea ?
Thank you,
Adrien
- Adrien De Coninck asked 7 years ago
- last active 7 years ago
I would like to add scroll listener on x axis title. Is it possible to add scroll to axis title
- Vinu Gilbert asked 3 years ago
- last active 3 years ago
Hi,
I am using Scichart android ,for Linking Chart Modifiers of Multiple charts I use these lines of code as shown below but it will not synchronize charts on X axis properley sometimes what is the reason ?
Is there is any other method to do that?
ModifierGroup chartModifiers2 = sciChartBuilder.newModifierGroup()
// Setting MotionEventsGroup
.withMotionEventsGroup(“SharedMotionEvents”).withReceiveHandledEvents(true)
.withLegendModifier().withShowCheckBoxes(true).withReceiveHandledEvents(true).build()
.withZoomPanModifier().withClipModeX(ClipMode.ClipAtExtents).withReceiveHandledEvents(true).build()
.withPinchZoomModifier().withReceiveHandledEvents(true).build()
.withZoomExtentsModifier().withReceiveHandledEvents(true).build()
.withRolloverModifier().withReceiveHandledEvents(true).build()
.build();
- sci chart asked 5 years ago
- last active 4 years ago
Hi,
How can we turn the light off and on in 3D drawings in Android studio?
Best regards…
- MUSTAFA KELSAKA asked 3 years ago
- last active 3 years ago
I have CategoryDateAxis and whant to setup range limit from series size – 50 to series size + 10
mBottomAxis.setVisibleRangeLimit(new DoubleRange(series.size() - 50d, series.size() + 10d));
mBottomAxis.setVisibleRangeLimitMode(RangeClipMode.MinMax);
And this code works but not as I expected
When I scrol chalt and hits the range limit scroll is stopped BUT chart is zooming in
How to disable zooming when I hits the limit?
- Evgeny Khramov asked 6 years ago
- last active 6 years ago
Can you help me please!
I was searching forum and see all different questions with dfferent ansvers but no one help for me.
I’m using CategoryDateAxis and whant to show to users vertical lines between days, weeks or month
Its depends from timestamp and visible period.
I need to opportunity to provide themself when to display vertical line.
In chart I display CandlestickSeries from stosk market and users whant to know when one day is ended and new day is begin.
How can I do that?
- Evgeny Khramov asked 6 years ago
- last active 6 years ago
I am still experiencing the effects of this defect despite using v2.5.0.2598 of the Android libraries. Can someone please explain to me how to circumvent this behavior? It seems silly to require a base series that is ultimately going to be replaced by real-time updates.
Cheers
- TJ Cook asked 5 years ago
- last active 5 years ago
Hi,
We want to use scichart for ios-android and wpf platforms to use in our applications developed by our company for Financial (Trading) purposes. In our review, we found that we can use Linear Trendline for wpf platform in your documents. However, there was no documentation for the android and ios platforms. Since Linear Trendline is of great importance for trading, it is important to know whether this feature is available or if it will be developed as a new feature by you. I would ask you to provide information on the subject.
- Emre Gökberk asked 4 years ago
- last active 4 years ago
Hi, I’ve been working on recyclerview with scichart.The problem i’m facing is that sometimes,when you come back from other screens the charts is not loading eventhough the other data in the list are showing.The list is placed inside a view pager .This issue is not consistant sometimes it shows the graph sometimes it won’t .The exception i’m getting are
java.lang.IllegalStateException: The specified child already has a parent. You must call removeView() on the child’s parent first.
at android.view.ViewGroup.addViewInner(ViewGroup.java:5260)
at android.view.ViewGroup.addView(ViewGroup.java:5089)
2021-08-17 14:50:52.639 15073-29533/com.fascilityconnex.voicemobile E/SciChart Rendering Errors: SciChartSurface has no XAxes. Please ensure SciChartSurface.XAxis is set, or SciChartSurface.XAxes has at least one axis
2021-08-17 14:50:52.641 15073-29531/com.fascilityconnex.voicemobile E/Exception: null
java.lang.UnsupportedOperationException: AxisCollection.getAxisById(‘DefaultAxisId’) returned more than one axis with the ID=DefaultAxisId. Please check you have assigned correct axis Ids when you have multiple axes in SciChart
at com.scichart.charting.model.AxisCollection.getAxisById(SourceFile:10)
- Vinu Gilbert asked 3 years ago
- last active 3 years ago
Hi,
I’m trying to use Android’s Magnifier widget on scichart surface but only annotations or crosshairs lines shows and magnify.
Chart series (line, candle etc.) not showing on magnifier window. Is it possible to show all chart surface with series?
Tnx.
- Dunya Biralem asked 4 years ago
- last active 4 years ago
Hi, I’m using the trial version for Xamarin. We wish to develop a mobile app which will have charting capabilities similar to our existing desktop application. I’ll provide an example of what we do (3 screenshots attached), can you please tell me if SciChart can do the same?
In #1 you see an FFT chart.
We select a data point by touching the screen.
In #2 you see a vertical blue line over the selected data point, plus 5 equidistant markers to the right.
We click a button to move right.
In #3 you see the 5 markers have moved to the right, the distance between them has increased slightly.
Is this something that SciChart can handle? Easily? With difficulty?
We want to write all the code in the common Xamarin project only (i.e. no iOS or Android specific code).
Thanks very much,
Wayne
- Wayne Murphy asked 4 years ago
- last active 4 years ago
Hello,
I am wanting to “force” an axis label on a specific value. For example, right now in my datetime graph it always shows a “5PM” time on the axis regardless of the data. Instead, I would like to “anchor” the axis ticks on a different time value, like local Noon. We were able to do this in our previous charting solution, but I have not yet figured out how to do it with SciChart.
Thank you.
- C Bolton asked 3 years ago
- last active 3 years ago
Hi,
I want to know how to set FastBandRenderableSeries withSeriesInfoProvider to null?
If i set null like sciChartBuilder.newBandSeries().withSeriesInfoProvider(null) i’m getting error on debug logs:
E/Exception: null
java.lang.NullPointerException: Attempt to invoke interface method ‘com.scichart.charting.visuals.renderableSeries.tooltips.ISeriesTooltip com.scichart.charting.visuals.renderableSeries.hitTest.ISeriesInfoProvider.getSeriesTooltip(java.lang.Class)’ on a null object reference
at com.scichart.charting.modifiers.behaviors.TooltipBehaviorBase.func(SourceFile:120)
at com.scichart.charting.modifiers.behaviors.TooltipBehaviorBase.func(SourceFile:35)
at com.scichart.core.utility.ListUtil.select(SourceFile:249)
at com.scichart.core.observable.ProjectionCollection.onCollectionChanged(SourceFile:186)
at com.scichart.core.observable.ObservableCollection.a(SourceFile:302)
at com.scichart.core.observable.ObservableCollection.a(SourceFile:79)
at com.scichart.core.observable.ObservableCollection.add(SourceFile:93)
at java.util.Collections.addAll(Collections.java:5447)
at com.ikon.prodigy.Fragments.FragmentUI.SciChartFragmentUI$1$3.run(SciChartFragmentUI.java:1057)
at com.scichart.core.framework.UpdateSuspender.using(SourceFile:122)
at com.ikon.prodigy.Fragments.FragmentUI.SciChartFragmentUI$1.run(SciChartFragmentUI.java:1013)
at android.os.Handler.handleCallback(Handler.java:793)
at android.os.Handler.dispatchMessage(Handler.java:98)
at android.os.Looper.loop(Looper.java:173)
at android.app.ActivityThread.main(ActivityThread.java:6698)
at java.lang.reflect.Method.invoke(Native Method)
at com.android.internal.os.Zygote$MethodAndArgsCaller.run(Zygote.java:240)
at com.android.internal.os.ZygoteInit.main(ZygoteInit.java:782)
- Emre Gökberk asked 4 years ago
- last active 4 years ago
Hello,
I’m wanting to switch to SciChart from a previous charting library. One neat thing that our previous library did that I cannot figure out how to do in SciChart is change the interaction between tooltips/rollover and panning.
What I would like to do is Pan/Drag the chart on short tap events, and do a rollover or tooltip cursor on long tap events. By default it looks like I get rollover and panning together on any tap event, which is not ideal behavior for my apps. Depending on the tap event type, I would like to do just one or the other, not both. How can I do something similar with SciChart?
Thank you,
- C Bolton asked 4 years ago
- last active 4 years ago
Hi,
When using splinerenderable series, there visual issues (as if the data points are unsorted) with the spline line at certain zoom levels.
If you zoom in past a certain point, the spline line corrects itself, showing that the data points are sorted in order.
See the attached screenshot and project replicating the issue.
This issue may be related to other issues currently active:
- Eyram Dornor asked 2 years ago
- last active 2 years ago
In my implementation I have the xAxis using a DateAxis in the dataset I am using there is only one data point.
The RolloverModifier is very sensitive it is very hard to highlight that one point.
RolloverModifier rolloverModifier = new VitalChartRolloverModifier();
rolloverModifier.setSourceMode(SourceMode.AllVisibleSeries);
rolloverModifier.setDrawVerticalLine(true);
rolloverModifier.setShowTooltip(true);
rolloverModifier.setShowAxisLabels(false);
rolloverModifier.setIsEnabled(true);
rolloverModifier.setUseInterpolation(false);
Is there a way of making it less sensitive?
- Simon Barnes asked 6 years ago
- last active 6 years ago
Hi,
i have some candles and i want to force the chart for removing candles with
open = Double.NaN
high = Double.NaN
low = Double.NaN
close = Double.NaN
openTime – special day (timestamp)
What I see:
- Vahid Garousi asked 1 year ago
- last active 4 months ago
Hi
I have added 24 Line graphs for EEG. Now I want to display the name of each channels against each graph. I am using Y steeped graph which you are using for Vital signs display in example code. Can you please let me know how to t to display the name of each channels against each graph
Best Regards,
Aditya
- Aditya Kadambi asked 3 years ago
- last active 3 years ago
Today is my first day using SciChart and I’m following along with this hello world demo –
For some reason Android Studio won’t recognize ‘SciChartBuilder.init(this)’. Am I missing a file? I can create an instance of SciChartSurface with no problem but the builder line is a no-go. I have imported and referenced the 4 correct .aar files in my gradle.build file so I’m not sure what else I’d be missing. Any help for a newbie would be appreciated!!
- Cory Giem asked 5 years ago
- last active 5 years ago
I am working on the spectrogram (heatmap) that can be interacted with fingers. It can only pan horizontally, and the Z values from heatmap will be updated whenever panning stopped.
I override onUp function from ZoomPanModifier to fetch the latest x range, which is temporarily logged by VisiableRangeChangeListener. But the issue is, when I’m panning with the finger horizontally, the chart will always be moving a little bit after onUp() occurred. So there’s a difference between the desired x range and actual x range.
Is there a way to get the final x range after a panning action?
Thanks.
- Gang Xu asked 4 years ago
- last active 3 years ago
Hi,
We want to implement averaging of data points when you zoom into a graph.
We have implemented pre-processed average plotting – and this works for certain cases.
Basically, you see less point markers when you zoom out a certain level (point marker will show averaged points), and when you zoom in, point markers show increased sample points – in real time.
- Is there a an API that enables this capability and determining when the averaging happens (at what zoom level) and the averaging period (to average values over)?
- If there isn’t an API, can you point us in the right direction to implement such feature?
- Eyram Dornor asked 2 years ago
- last active 4 months ago
Hi All
By default legends are being draw on scichart surface. I want to draw them outside the scichart surface because as the number of render-able series increase legends hides them. Please give me suggestion how do i do it ?
- Developer Mt asked 6 years ago
- last active 6 years ago
When I open the activity with the chart , I see a black screen. And there is no graph displayed.
I have a trial license key which is valid.
Here is my full code:
xml file:
<?xml version="1.0" encoding="utf-8"?>

<LinearLayout xmlns:android="http://schemas.android.com/apk/res/android"
xmlns:tools="http://schemas.android.com/tools"
android:layout_width="match_parent"
android:layout_height="match_parent"
android:id="@+id/chart_layout"
android:orientation="vertical">
Activity:
public class ECGMonitorFragment extends AppCompatActivity {

@Override
protected void onCreate(Bundle savedInstanceState) {
    super.onCreate(savedInstanceState);
    try {
        com.scichart.charting.visuals.SciChartSurface.setRuntimeLicenseKey("");
    } catch(Exception e){

        Log.e("SciChart", "Error while accesing the license", e);
    }


    setContentView(R.layout.activity_ecgmonitor_fragment);


    // Create a SciChartSurface
    final SciChartSurface surface = new SciChartSurface(this);

    // Get a layout declared in "activity_main.xml" by id
    LinearLayout chartLayout = (LinearLayout) findViewById(R.id.chart_layout);

    // Add the SciChartSurface to the layout
    chartLayout.addView(surface);

    // Initialize the SciChartBuilder
    SciChartBuilder.init(this);

    // Obtain the SciChartBuilder instance
    final SciChartBuilder sciChartBuilder = SciChartBuilder.instance();

    // Create a numeric X axis
    final IAxis xAxis = sciChartBuilder.newNumericAxis()
            .withAxisTitle("X Axis Title")
            .withVisibleRange(-5, 15)
            .build();

    // Added in Tutorial #8 - two Y axes
    // Create a numeric axis, right-aligned
    final IAxis yAxisRight = sciChartBuilder.newNumericAxis()
            .withAxisTitle("Primary")
            // Assign a unique ID to the axis
            .withAxisId("primaryYAxis")
            .withAxisAlignment(AxisAlignment.Right)
            .build();

    // Create another numeric axis, left-aligned
    final IAxis yAxisLeft = sciChartBuilder.newNumericAxis()
            .withAxisTitle("Secondary")
            // Assign a unique ID to the axis
            .withAxisId("secondaryYAxis")
            .withAxisAlignment(AxisAlignment.Left)
            .withGrowBy(0.2,0.2)
            .build();

    // Add both Y axes to the YAxes collection of the surface
    Collections.addAll(surface.getYAxes(), yAxisLeft, yAxisRight);

    // Added in Tutorial #3
    // Add a bunch of interaction modifiers to a ModifierGroup
    ModifierGroup chartModifiers = sciChartBuilder.newModifierGroup()
            // Setting MotionEventsGroup
            .withMotionEventsGroup("SharedMotionEvents").withReceiveHandledEvents(true)
            .withPinchZoomModifier().build()
            .withZoomPanModifier().withReceiveHandledEvents(true).build()
            .withZoomExtentsModifier().withReceiveHandledEvents(true).build()
            .withXAxisDragModifier().withReceiveHandledEvents(true).withDragMode(AxisDragModifierBase.AxisDragMode.Scale).withClipModeX(ClipMode.None).build()
            .withYAxisDragModifier().withReceiveHandledEvents(true).withDragMode(AxisDragModifierBase.AxisDragMode.Pan).build()
            .build();

    // Add the X axis to the XAxes collection of the surface
    Collections.addAll(surface.getXAxes(), xAxis);

    // Add the interactions to the ChartModifiers collection of the surface
    Collections.addAll(surface.getChartModifiers(), chartModifiers);

    // Added in Tutorial #6 - FIFO (scrolling) series
    // Create a couple of DataSeries for numeric (Int, Double) data
    // Set FIFO capacity to 500 on DataSeries
    final int fifoCapacity = 500;

    final XyDataSeries lineData = sciChartBuilder.newXyDataSeries(Integer.class, Double.class)
            .withFifoCapacity(fifoCapacity)
            .build();
    final XyDataSeries scatterData = sciChartBuilder.newXyDataSeries(Integer.class, Double.class)
            .withFifoCapacity(fifoCapacity)
            .build();

    // Create and configure a line series
    final IRenderableSeries lineSeries = sciChartBuilder.newLineSeries()
            .withDataSeries(lineData)
            // Register on a particular Y axis using its ID
            .withYAxisId("primaryYAxis")
            .withStrokeStyle(ColorUtil.LightBlue, 2f, true)
            .build();

    // Create an Ellipse PointMarker for the Scatter Series
    EllipsePointMarker pointMarker = sciChartBuilder
            .newPointMarker(new EllipsePointMarker())
            .withFill(ColorUtil.LightBlue)
            .withStroke(ColorUtil.Green, 2f)
            .withSize(10)
            .build();

    // Create and configure a scatter series
    final IRenderableSeries scatterSeries = sciChartBuilder.newScatterSeries()
            .withDataSeries(scatterData)
            // Register on a particular Y axis using its ID
            .withYAxisId("primaryYAxis")
            .withPointMarker(pointMarker)
            .build();

    // Add a RenderableSeries onto the SciChartSurface
    surface.getRenderableSeries().add(scatterSeries);
    surface.getRenderableSeries().add(lineSeries);
    surface.zoomExtents();

    // Added in Tutorial #5
    // Create a LegendModifier and configure a chart legend
    ModifierGroup legendModifier = sciChartBuilder.newModifierGroup()
            .withLegendModifier()
            .withOrientation(Orientation.HORIZONTAL)
            .withPosition(Gravity.CENTER_HORIZONTAL | Gravity.BOTTOM, 10)
            .build()
            .build();

    // Add the LegendModifier to the SciChartSurface
    surface.getChartModifiers().add(legendModifier);

    // Create and configure a CursorModifier
    ModifierGroup cursorModifier = sciChartBuilder.newModifierGroup()
            // Setting MotionEventsGroup
            .withMotionEventsGroup("SharedMotionEvents").withReceiveHandledEvents(true)
            .withCursorModifier().withShowTooltip(true).build()
            .build();

    // Add the CursorModifier to the SciChartSurface
    surface.getChartModifiers().add(cursorModifier);

    // Added in Tutorial #9 - one more SciChartSurface
    final SciChartSurface surface2 = new SciChartSurface(this);

    // Add the SciChartSurface to the layout
    chartLayout.addView(surface2);

    // Set layout parameters for both surfaces
    LinearLayout.LayoutParams layoutParams = new LinearLayout.LayoutParams(LinearLayout.LayoutParams.MATCH_PARENT, LinearLayout.LayoutParams.MATCH_PARENT, 1.0f);
    surface.setLayoutParams(layoutParams);
    surface2.setLayoutParams(layoutParams);

    // Create a numeric X axis
    final IAxis xAxis2 = sciChartBuilder.newNumericAxis()
            .withAxisTitle("X Axis Title")
            .withVisibleRange(-5, 15)
            .build();

    // Create a numeric axis
    final IAxis yAxisRight2 = sciChartBuilder.newNumericAxis()
            .withAxisTitle("Primary")
            .withAxisId("primaryYAxis")
            .withAxisAlignment(AxisAlignment.Right)
            .build();

    // Create another numeric axis
    final IAxis yAxisLeft2 = sciChartBuilder.newNumericAxis()
            .withAxisTitle("Secondary")
            .withAxisId("secondaryYAxis")
            .withAxisAlignment(AxisAlignment.Left)
            .withGrowBy(0.2, 0.2)
            .build();

    // Add the Y axis to the YAxes collection of the surface
    Collections.addAll(surface2.getYAxes(), yAxisLeft2, yAxisRight2);

    // Add the X axis to the XAxes collection of the surface
    Collections.addAll(surface2.getXAxes(), xAxis2);

    // Create and configure an area series
    final IRenderableSeries areaSeries = sciChartBuilder.newMountainSeries()
            .withDataSeries(scatterData)
            .withYAxisId("primaryYAxis")
            .withStrokeStyle(ColorUtil.LightBlue, 2f, true)
            .withAreaFillColor(ColorUtil.argb(ColorUtil.LightSteelBlue, 0.6f))
            .build();

    // Add the area series to the RenderableSeries collection of the surface
    Collections.addAll(surface2.getRenderableSeries(), areaSeries);

    // Create the second collection of chart modifiers
    ModifierGroup chartModifiers2 = sciChartBuilder.newModifierGroup()
            // Setting MotionEventsGroup
            .withMotionEventsGroup("SharedMotionEvents").withReceiveHandledEvents(true)
            .withZoomExtentsModifier().withReceiveHandledEvents(true).build()
            .withZoomPanModifier().withReceiveHandledEvents(true).build()
            .withPinchZoomModifier().withReceiveHandledEvents(true).build()
            .withCursorModifier().withReceiveHandledEvents(true).build()
            .build();

    // Add the interactions to the ChartModifiers collection of the surface
    Collections.addAll(surface2.getChartModifiers(), chartModifiers2);

    TimerTask updateDataTask = new TimerTask() {
        private int x = 0;

        @Override
        public void run() {
            UpdateSuspender.using(surface, new Runnable() {
                @Override
                public void run() {
                    lineData.append(x, Math.sin(x * 0.1));
                    scatterData.append(x, Math.cos(x * 0.1));

                    // Added in Tutorial #7
                    // Add an annotation every 100 data points
                    if(x%100 == 0) {
                        TextAnnotation marker = sciChartBuilder.newTextAnnotation()
                                // Register on a particular Y axis using its ID
                                .withYAxisId("primaryYAxis")
                                .withIsEditable(false)
                                .withText("N")
                                .withBackgroundColor(ColorUtil.Green)
                                .withX1(x)
                                .withY1(0.0)
                                .withVerticalAnchorPoint(VerticalAnchorPoint.Center)
                                .withHorizontalAnchorPoint(HorizontalAnchorPoint.Center)
                                .withFontStyle(20, ColorUtil.White)
                                .withZIndex(1)
                                .build();

                        surface.getAnnotations().add(marker);

                        // Remove one annotation from the beginning
                        // in the FIFO way
                        if(x > fifoCapacity){
                            surface.getAnnotations().remove(0);
                        }
                    }

                    // Zoom series to fit the viewport
                    surface.zoomExtents();
                    surface2.zoomExtents();
                    ++x;
                }
            });
        }
    };

    Timer timer = new Timer();

    long delay = 0;
    long interval = 10;
    timer.schedule(updateDataTask, delay, interval);

}
}
- Aditya Kadambi asked 3 years ago
- last active 3 years ago
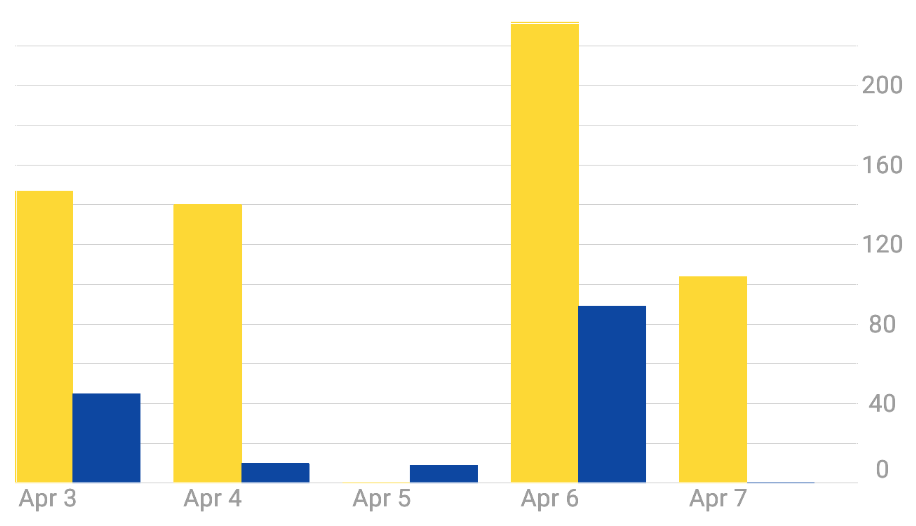
I have a basic StackedColumnRenderableSeries using a HorizontallyStackedColumnCollection, which has 2 DataSeries in it. The chart renders fine, and for each point on the x axis, I see the 2 bars. However, the labels on the x Axis are left aligned (relative to the bars). How do I get the labels to be centered under the bars? See the image below for reference. Note how the labels appear left aligned under the yellow bars… I’d like them to be center aligned, in the middle of the yellow and blue bars.
- Brad Ball asked 4 years ago
- last active 4 years ago
Lets imagine that we have zoom feature and we want to format axis depend on user selected zoom. for example if year select yearly the pattern is yyyy MM dd and if selected zoom is day the pattern is something like this HH:mm:ss. how we can achieve to this goal?
- Vahid Garousi asked 1 year ago
- last active 4 months ago
I have two questions on rollover modifier.
One is the tooltip of the rollover is right under the finger on a heatmap chart. Can I move it to the top left section of the touch point?
Second question is how can I implement a callback function whenever Y axis of the rollover modifier changes?
Thanks for your attention in advance.
- Gang Xu asked 4 years ago
- last active 4 years ago
If you set limit on range of axis, the pinch gesture will not work correctly.
Pinch the chart and hold for a while (about less than 1 sec), the chart will resize to the limit value you set on the axis.
You can change code of OscilloscopeFragment.java#106 in Examples to below to reproduce this problem.
final IAxis xBottomAxis = sciChartBuilder.newNumericAxis()
                    .withAutoRangeMode(AutoRange.Never)
                    .withAxisTitle("Time (ms)")
                    .withVisibleRange(new DoubleRange(2.5, 4.5))
                    .withVisibleRangeLimit(0,20)   // this will help reproduce the problem
                    .build();
- zhengyang qu asked 5 years ago
- last active 5 years ago
Hello there. At the beginning of the program, I define the workspace as w=10 and h=10 units. I set the new workspace to 5×5 in a button event. The new workspace is created but the old 10×10 volume remains on the screen. When I create the new workspace I want the old one to disappear. Thank you in advance for your help. Good work.
My button event.
btnSetNewWH.setOnClickListener(new View.OnClickListener() {
    @Override
    public void onClick(View view) {
w = 5;
h = 5;
ds3d = new UniformGridDataSeries3D<>(Double.class, Double.class, Double.class, w, h);

rs1 = sciChart3DBuilder.newSurfaceMeshSeries3D()
        .withDataSeries(ds3d)
        .withDrawMeshAs(DrawMeshAs.SolidWireframe)
        .withStroke(0xFFE0E0E0)
        .withStrokeThicknes(1f)
        .withMaximum(5000)
        .withDrawSkirt(false)
        .withMeshColorPalette(new GradientColorPalette(colors, stops))
        .withOpacity(1.0f)
        .build();

surface3d.setTheme(R.style.SciChart_ElectricStyle);
surface3d.setCamera(camera);
surface3d.setXAxis(xAxis);
surface3d.setYAxis(yAxis);
surface3d.setIsFpsCounterVisible(false);
surface3d.setZAxis(zAxis);
surface3d.getRenderableSeries().add(rs1);
surface3d.getChartModifiers().add(sciChart3DBuilder.newModifierGroupWithDefaultModifiers().build());
    }
});
- MUSTAFA KELSAKA asked 3 years ago
- last active 3 years ago
Hello Friends ,
Sync two Chart in Android Bottom chart can be change on top chart touch
We are looking a solution where we want show two chart at Top and Bottom in Android Screen.based on Top chart changed by gesture /finger touch should be expend/shrink like zoom in and out bottom chart
Assume at top chart data range has between 0 to 3,00,000 , I want to capture in bottom chart only selected/touched part in with expanded form.
I have attached below screen shot which may be helpful.
Solution can be like this but not able to get code for this implementation
https://blog.scichart.com/content/images/2021/06/Navigate-ECG-strip-with-Pocket-ECM.gif
https://blog.scichart.com/android-app-to-view-long-term-ecg-signals/
I appreciate any help regarding this issue.
- vasim simform asked 3 years ago
- last active 2 years ago
Hi,
I downloaded your Android Examples project to evaluate whether it’ll be a good fit for real time updates.
Replaced SetRunTimeLicenseKey call with my trial keys.
Designer time window displays Sorry!you have not set a LicenseKey message.
RunTime displays your trial license expired.
Any help on this would be great.
Thanks
- Raji S asked 6 years ago
- last active 4 years ago
Hello. Some time ago we started receiving very interesting crash reports in our crashlytics about scichart init. We can’t reproduce it by ourselves, but there are a lot of samples from our users with different devices and with different Android OS.
Fatal Exception: java.lang.UnsatisfiedLinkError: dalvik.system.PathClassLoader[DexPathList[[zip file "/data/app/com.**.**-WqNyhtp24SkSTYz13S2c3w==/base.apk"],nativeLibraryDirectories=[/data/app/com.**.**-WqNyhtp24SkSTYz13S2c3w==/lib/arm64, /system/lib64]]] couldn't find "libcore.so"
       at java.lang.Runtime.loadLibrary0(Runtime.java:1067)
       at java.lang.Runtime.loadLibrary0(Runtime.java:1007)
       at java.lang.System.loadLibrary(System.java:1667)
       at com.scichart.core.utility.NativeLibraryHelper.tryLoadLibrary(SourceFile:2)
       at com.scichart.core.utility.NativeLibraryHelper.tryLoadCoreLibrary(:2)
       at com.scichart.core.licensing.Credentials.<clinit>(SourceFile:1)
       at com.scichart.core.licensing.Credentials.setRuntimeLicenseKey(SourceFile:1)
       at com.scichart.charting.visuals.SciChartSurface.setRuntimeLicenseKey()
At our last build we added
abi {
    enableSplit = false
}
This action reduced the number of crashes, but it still happens:
Fatal Exception: java.lang.UnsatisfiedLinkError: dlopen failed: couldn't map "/mnt/asec/com.**.**-2/base.apk!/lib/armeabi-v7a/libcore.so" segment 1: Permission denied
       at java.lang.Runtime.loadLibrary0(Runtime.java:989)
       at java.lang.System.loadLibrary(System.java:1567)
       at com.scichart.core.utility.NativeLibraryHelper.tryLoadLibrary(SourceFile:2)
       at com.scichart.core.utility.NativeLibraryHelper.tryLoadCoreLibrary(SourceFile)
       at com.scichart.core.licensing.Credentials.<clinit>(SourceFile:1)
       at com.scichart.core.licensing.Credentials.setRuntimeLicenseKey(SourceFile:1)
       at com.scichart.charting.visuals.SciChartSurface.setRuntimeLicenseKey(SourceFile)
Have there been similar problems?
- Alexander Ostrovsky asked 1 year ago
- last active 1 year ago
Can Annotation in editing state set the editing style, or the background of editing state?
- Huang haiyan asked 5 years ago
- last active 5 years ago
Hi,
How can I programmatically prevent panning, zooming, yaw, pitch movements on the screen whenever I want?
Best regards…
- MUSTAFA KELSAKA asked 3 years ago
- last active 3 years ago
Hi,
I’m working on the iOS and android version. I’m trying to implemented an animated visible range change on Y axis when zooming/panning X axis.
On iOS, I just have to do:
yAxis.autoRange = .always
yAxis.animateVisibleRangeChanges = true
yAxis.animatedChangeDuration = 0.5
But I can’t find a way to do that on Android, is it hidden somewhere else?
Kind Regards,
Alexis
- Alexis Durand asked 6 years ago
- last active 6 years ago
See the Attached image — On the right side in addition to the labels 0.01% – 20.0%; Their is a color coded chart of AAA through C/D.
I need this to also be part of the chart; or maybe a separate control that can be transformed and zoomed based on where the chart is at.
If I’m zoomed in on the 0.15% – 0.50% then the B/BB/BBB should also be zoomed in to match the current scale of the chart.
Ideas on how to handle this. I’ve tagged this question as Android, but I will also need a solution for iOS.
- Nathanael Anderson asked 4 years ago
- last active 4 years ago
hello all,
when i import a scichart into android studio layout editor , i got these exception, have you ever seen it ?
java.lang.VerifyError: Expecting a stackmap frame at branch target 111
Exception Details:
  Location:
    com/scichart/charting/visuals/layout/LayoutableViewGroup.onLayout_Original(ZIIII)V @25: if_icmpge
  Reason:
    Expected stackmap frame at this location.
  Bytecode:
    0x0000000: 2ab6 004a 3606 1504 1c64 3607 1505 1d64
    0x0000010: 3608 0336 0915 0915 06a2 0056 2a15 09b6
    0x0000020: 004e 3a0a 190a b600 5310 089f 003e 190a
    0x0000030: c100 5599 002b 190a c000 55b9 0059 0100
    0x0000040: 3a0b 190a 190b b400 5e19 0bb4 0061 190b
    0x0000050: b400 6419 0bb4 0067 b600 6ba7 000e 190a
    0x0000060: 0303 1507 1508 b600 6b84 0901 a7ff a9b1
    0x0000070:

    at java.lang.Class.getDeclaredConstructors0(Native Method)
    at java.lang.Class.privateGetDeclaredConstructors(Class.java:2671)
    at java.lang.Class.getConstructor0(Class.java:3075)
    at java.lang.Class.getConstructor(Class.java:1825)
    at org.jetbrains.android.uipreview.ViewLoader.createNewInstance(ViewLoader.java:396)
    at org.jetbrains.android.uipreview.ViewLoader.loadClass(ViewLoader.java:172)
    at org.jetbrains.android.uipreview.ViewLoader.loadView(ViewLoader.java:105)
    at com.android.tools.idea.rendering.LayoutlibCallbackImpl.loadView(LayoutlibCallbackImpl.java:186)
    at android.view.BridgeInflater.loadCustomView(BridgeInflater.java:334)
    at android.view.BridgeInflater.loadCustomView(BridgeInflater.java:345)
    at android.view.BridgeInflater.createViewFromTag(BridgeInflater.java:245)
    at android.view.LayoutInflater.createViewFromTag(LayoutInflater.java:727)
    at android.view.LayoutInflater.rInflate_Original(LayoutInflater.java:858)
    at android.view.LayoutInflater_Delegate.rInflate(LayoutInflater_Delegate.java:70)
    at android.view.LayoutInflater.rInflate(LayoutInflater.java:834)
    at android.view.LayoutInflater.rInflateChildren(LayoutInflater.java:821)
    at android.view.LayoutInflater.inflate(LayoutInflater.java:518)
    at android.view.LayoutInflater.inflate(LayoutInflater.java:397)
    at com.android.layoutlib.bridge.impl.RenderSessionImpl.inflate(RenderSessionImpl.java:324)
    at com.android.layoutlib.bridge.Bridge.createSession(Bridge.java:429)
    at com.android.ide.common.rendering.LayoutLibrary.createSession(LayoutLibrary.java:389)
    at com.android.tools.idea.rendering.RenderTask$2.compute(RenderTask.java:548)
    at com.android.tools.idea.rendering.RenderTask$2.compute(RenderTask.java:533)
    at com.intellij.openapi.application.impl.ApplicationImpl.runReadAction(ApplicationImpl.java:966)
    at com.android.tools.idea.rendering.RenderTask.createRenderSession(RenderTask.java:533)
    at com.android.tools.idea.rendering.RenderTask.lambda$inflate$72(RenderTask.java:659)
    at java.util.concurrent.FutureTask.run(FutureTask.java:266)
    at java.util.concurrent.ThreadPoolExecutor.runWorker(ThreadPoolExecutor.java:1142)
    at java.util.concurrent.ThreadPoolExecutor$Worker.run(ThreadPoolExecutor.java:617)
    at java.lang.Thread.run(Thread.java:745)
(I use the new constraintlayout from android)
- Davy Thibaut asked 8 years ago
- last active 7 years ago
I have some complex data & am showing each dataset as a different colour, but I would like to be able to customise the legends.
I am interested in having 2 legends, one with each data set, showing the colour, and preferably, limited to a set number with the option to scroll, and the other showing that solid lines are the left Y axis, and the dashed lines are the right Y axis.
My question is, is there a way to apply a custom skin to the Legend & is there a way to show dashed lines instead of just a big coloured square in the legend?
- Peter Brittain asked 5 years ago
- last active 5 years ago
Hi,
In Android MVVM architecture, I am trying to @Inject ISuspendable through ViewModelModule, as I cannot pass this to my VMModel constructor.
@Module
abstract class ViewModelModule {

    @Singleton
    @Binds
    abstract fun getSuspendable(aSuspendable: ACMSuspendableImpl): ISuspendable

@Binds
    @IntoMap
    @ViewModelKey(MonitorViewModel::class)
    abstract fun bindsMonitorViewModell(monitorViewModel: MonitorViewModel): ViewModel
}


@Singleton
class ACMSuspendableImpl @Inject constructor() : ISuspendable {


    override fun decrementSuspend() {
    }

    override fun suspendUpdates(): IUpdateSuspender {
        TODO("not implemented")
    }

    override fun getIsSuspended(): Boolean {
        TODO("not implemented")
    }

    override fun resumeUpdates(p0: IUpdateSuspender?) {
    }
}
whereas my MonitorViewModel class as,
class MonitorViewModel @Inject constructor(context: Context) : BaseViewModel()  {

    @Inject
    lateinit var acmSuspend: ISuspendable


private fun loadMonitorData() {

        UpdateSuspender.using(acmSuspend) { //<! NULL ->
            iapDataSeries.append(Timestamp.valueOf(mData100Hz.getRtcTimeStamp().toString()), mData100Hz.emr.iap)
            uoColumnDataSeries.append(
                Timestamp.valueOf(mData100Hz.getRtcTimeStamp().toString()),
                mData100Hz.emr.totalVolume
            )
      }
}
How should I @Inject ISuspendable so that it should not be NULL. Please provide me some example snipped to work.
FYI,
I tried to follow the ECGViewModel but this sample used some custom solution and there is no use of DI.
BR,
Praween
- Praween Kumar asked 5 years ago
- last active 5 years ago
Hi, I’m a software engineer. My organization is ready to purchase your solution for our project(Android, IOS), but I have some questions:
1. Can I get a callback when the visible area on the x axis changes? This is necessary to dynamically upload data to the end of the graph when the user scrolls back.
2. Change the position of the tooltip and place in the upper corner of the chart?
Thank you for your time and hope for further cooperation.
Evgeniy Grishko, software engineer.
- Evgeniy Grishko asked 5 years ago
- last active 5 years ago

So I am trying to set paddings on the chart, so that the data series do not touch chart edges
I can’t do it with View’s method setPadding because then the black background is present (screenshot shows padding on all sides but I need just left and right)
Also, I managed to achieve no labels, axes, grids etc. but in totally hacky way; I set .withIsCenterAxis and then all other things to false
 .withAxisId(Y_AXIS_ID)
        .withDrawMajorBands(false)
        .withDrawMajorGridLines(false)
        .withDrawMinorGridLines(false)
        .withDrawLabels(false)
        .withIsCenterAxis(true)
        .withDrawMajorTicks(false)
        .withDrawMinorTicks(false)
Is there a normal way of doing this?
thanks
- Laszlo Bonkers asked 5 years ago
- last active 5 years ago
Hi,
I am using Sci Chart android I want to Share/Link Custom Modifier on Multiple Charts ,
How Can i do that?
- sci chart asked 5 years ago
- last active 4 years ago
I’m seeing the following exception:
E/Exception: null
    java.lang.ArrayIndexOutOfBoundsException: length=0; index=-1
        at com.scichart.core.model.DoubleValues.get(SourceFile:167)
        at com.scichart.charting.numerics.tickProviders.LogarithmicNumericTickProvider.updateTicks(SourceFile:94)
        at com.scichart.charting.numerics.tickProviders.TickProvider.update(SourceFile:59)
        at com.scichart.charting.numerics.tickProviders.DeltaTickProvider.update(SourceFile:81)
        at com.scichart.charting.visuals.axes.AxisBase.onUpdateMeasure(SourceFile:957)
        at com.scichart.charting.visuals.axes.AxisBase.updateAxisMeasurements(SourceFile:936)
        at com.scichart.charting.layoutManagers.RightAlignmentOuterAxisLayoutStrategy.measureAxes(SourceFile:39)
        at com.scichart.charting.layoutManagers.DefaultLayoutManager.onLayoutChart(SourceFile:235)
        at com.scichart.charting.visuals.rendering.RenderSurfaceRenderer.a(SourceFile:207)
        at com.scichart.charting.visuals.rendering.RenderSurfaceRenderer.a(SourceFile:132)
        at com.scichart.charting.visuals.rendering.RenderSurfaceRenderer.onDraw(SourceFile:123)
        at com.scichart.drawing.opengl.RenderSurfaceGL$a.onDraw(SourceFile:234)
        at com.scichart.drawing.opengl.MyGLRenderer.b(SourceFile:299)
        at com.scichart.drawing.opengl.MyGLRenderer.onDrawFrame(SourceFile:283)
        at android.opengl.GLSurfaceView$GLThread.guardedRun(GLSurfaceView.java:1571)
        at android.opengl.GLSurfaceView$GLThread.run(GLSurfaceView.java:1270)
I’m initializing my chart as follows:
SciChartBuilder.init(context)
builder = SciChartBuilder.instance()

...

val xAxis = builder.newCategoryDateAxis()
                            .withGrowBy(0.0, 0.05)
                            .withAxisAlignment(AxisAlignment.Bottom)
                            .withVisibleRange(sharedXRange)
                            .withDrawMinorGridLines(true)
                            .withDrawMajorGridLines(true)
                            .build()
val yAxis = builder.newLogarithmicNumericAxis()
                            .withTextFormatting("#.#E+0")
                            .withScientificNotation(ScientificNotation.LogarithmicBase)
                            .withLogarithmicBase(2.0)
                            .build()
val seriesData = builder.newXyDataSeries(Date::class.java, Double::class.javaObjectType)
                            .withSeriesName("Series A")
                            .build()
seriesData.append(data.dateData, data.yData)
series = builder.newLineSeries()
                            .withDataSeries(seriesData)
                            .build()

UpdateSuspender.using(surface) {
                Collections.addAll(surface.xAxes, xAxis)
                Collections.addAll(surface.yAxes, yAxis)
                Collections.addAll(surface.renderableSeries, series)
}
data object has about 300 valid data points.
Any ideas what’s going on? I tried running this on a new activity. If I swap LogarithmicNumericAxis for a NumericAxis, everything works fine. I looked at the decompiled .class file where the crash was occurring (I don’t have the source for SciChart), and it seems like the crash occurs when major ticks fail to get generated (majorTicks.size == 0). I tried disabling all minor/major ticks but no joy.
for(int var22 = majorTicks.size(); var22 >= 0; --var22) {
            double var23 = var4.fromExponent(var11);
            double var25 = var22 < majorTicks.size() ? majorTicks.get(var22) : majorTicks.get(var22 - 1) * var23;
- Mike Liu asked 6 years ago
- last active 6 years ago
