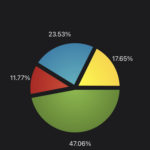
Hi guys,
I have some troubles with piecharts in swift. I want to provide custom labels outside of the piecharts segments. I found a screenshot of a nested piechart attached to an issue in your issue tracker. Thats what I want to do in swift, but I couldn’t find out a way to do so. Could you please provide an example code?
Thanks a lot in advance!
Alex
- You must login to post comments
Hi, Alexander.
The easiest way to achieve this without overriding the drawing engine is to add second donut series with clear color and the same segments as your pieSeries has.
let pieSeries = SCIPieRenderableSeries()
    pieSeries.segmentsCollection.add(segmentWithValue(segmentValue: 40, title: "Green", centerColor: 0xff84BC3D, edgeColor: 0xff5B8829))

    let donutSeries = SCIDonutRenderableSeries()
    donutSeries.segmentsCollection.add(segmentWithValue(segmentValue: 40, title: "Green", centerColor: 0x00000000, edgeColor: 0x00000000))

    surface.renderableSeries.add(pieSeries)
    surface.renderableSeries.add(donutSeries)

    surface.seriesSpacing = 0

    pieSeries.drawLabels = false

func segmentWithValue(segmentValue: Double, title: String, centerColor: UInt32, edgeColor: UInt32) -> SCIPieSegment {
    let segment = SCIPieSegment()
    segment.value = segmentValue
    segment.title = title
    segment.fillStyle = SCIRadialGradientBrushStyle(centerColorCode: centerColor, edgeColorCode: edgeColor)
    segment.titleStyle = SCIFontStyle(textColor: .white)

    segment.strokeStyle = SCISolidPenStyle(color: .clear, thickness: 0)

    return segment
}
I hope, that helped.
- Andriy P answered 3 years ago
 Hi Andriy, thanks a lot for your fast response! That seems to be a pragmatic way to place value labels next to the segments of a pie chart. But to add the titles of the segments as well I assume there is no other way than to use an override func within a custom label provider class. And I can’t find a solution for this problem in the developer documentation for pie charts/donut charts. Using a custom label provider for a numerical axis of a column series for example was not a problem. May be you have a sample code for this purpose as well? Thank you very much in advance! Alex
 Did it! It works using the LabelFormatter protocol and the „formatLabel“ function. A bit complicated but combined with the suggestion of Andriy I have what I wanted!
- You must login to post comments
Please login first to submit.


