Hi all,
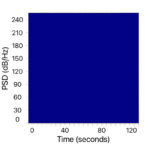
I am using the iOS SciCharts version to implement a heatmap series in my application. I am testing out the heatmap by providing a test series of random 100 zValues that range from 1-200. The Heatmap with the stops below just appears blue (see image). My suspicion is that either I am not updating the zValues correctly or the andStops is too low. Can anyone provide insights on what could be the issue?
//Test zValues
let SpectTestArray: [Double] = [ 12,  14, 68, 137, 164, 124, 124, 122, 162, 128, 45, 129,  40,  91,  53, 159,  77,  59,   0,  91, 92,  73,  77,  67, 163,  69, 149, 115,  17,  85, 119, 129, 186,  93,  80,  34, 159, 115,  65, 181, 159,  67, 152,  29,   6, 162,  51, 196, 186, 122, 114, 171, 159, 116,  20, 102,   4, 174, 144, 160, 89,  51,  89, 130, 172, 186,  40, 174,  20, 120, 88, 151, 127, 167,  10,  49, 198,  67, 184, 197, 152, 193, 196, 163,  18,  77,  17, 143, 124, 115, 1, 115, 126,  22,  35,   6,  58, 121,  77,   5]

let colors = [UIColor.fromARGBColorCode(0xFF00008B)!, UIColor.fromARGBColorCode(0xFF6495ED)!, UIColor.fromARGBColorCode(0xFF006400)!, UIColor.fromARGBColorCode(0xFF7FFF00)!, UIColor.yellow, UIColor.red]

CH1HeatMapRenderableSeries = SCIFastUniformHeatmapRenderableSeries()
        CH1HeatMapRenderableSeries.dataSeries = CH1SpectDataSeries
        CH1HeatMapRenderableSeries.minimum = 0.0
        CH1HeatMapRenderableSeries.maximum = 200.0
        CH1HeatMapRenderableSeries.colorMap = SCIColorMap(colors: colors, andStops: [0.0, 0.2, 0.4, 0.6, 0.8, 1.0])
        spectchartsurface?.renderableSeries.add(CH1HeatMapRenderableSeries)

        var Spectvalues = SCIDoubleValues(capacity: 100)

        for n in 0...SpectTestArray.count-1 {
            Spectvalues.add(SpectTestArray[n])
        }
//        print(Spectvalues)
        CH1SpectDataSeries.update(z: Spectvalues)
- Ayushi Patel asked 3 years ago
 Hi Ayushi, Thanks for your inquiry. Unfortunately, we have noticed your license support has expired. If you wish to continue receiving technical support further please consider renewing your support subscription. To do that please contact Sales here: https://www.scichart.com/contact-us/ Or email us at [email protected] With best regards, Oleksandr
- You must login to post comments
Hi, there. ‘Stops’ parameter is used for gradient color calculation and probably isn’t the reason for your issue.
I don’t see the code where you create your CH1SpectDataSeries. Probably, you provide the wrong xSize and ySize.
In your case it should look something like this:
let xSize = 10
CH1SpectDataSeries = SCIUniformHeatmapDataSeries(xType: .int, yType: .int, zType: .double, xSize: xSize, ySize: SpectTestArray.count / xSize)
So, zValue size should be the product of xSize and ySize.
In this case zValues count will be xSize * ySize = 10 * SpectTestArray.count / 10 = SpectTestArray.count
Since you have 100 values in SpectTestArray and you want to have 10 cells in x-direction this will create a heatmap with 10×10, because there will be 10 X-cells for each Y-cell. See the screenshot.
You can find more about Heatmap here
Also, you can find Heatmap Chart here
Let us know if that helped.
- Andriy P answered 3 years ago
- You must login to post comments
Please login first to submit.

