Hello,
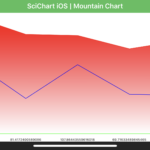
I am using mountain chart to draw some data. First time open the chart screen, the graph plots properly. If we do scroll forward the graph x-axis last label is missing. If we do scroll backward the graph x-axis first label is missing.
Here I have attached working .swift file.
Note: We are using mountain chart with multiple line series. We are not using stacked mountain chart.
- Abhijeet Upadhyay asked 5 years ago
- You must login to post comments
Hello Abhijeet,
Thanks for the provided code, I’ve tried it, and unfortunately can’t reproduce this behaviour in the latest SciChart v2.

I remember there were an issue which is already fixed, so please make sure you are using the latest version available.
If the issue still persist, I would ask you to provide runnable demo, so we can easily reproduce the issue on our side and help you fix it as soon as we can.
Best Regards,
Nazar R.
- Nazar Rudnyk answered 4 years ago
- last edited 4 years ago
- You must login to post comments
Please login first to submit.

