Hi,
I would like to display the rollovermodifier line that must be parallel to the X axis and the Rollovermodifier line must be a dashed line. In the y axis I need to add a label annotation with svg .How can I fix the problem. Kindly provide me the solution.
This is the code I have given,
const horizontalline = new RolloverModifier({
IsEnabled: true,
DrawVerticalLine: true,
showTooltip: false,
rolloverLineStroke: “white”,
rolloverLineStrokeThickness : 1
})
sciChartSurface.chartModifiers.add(horizontalline);


- Ayana VS asked 2 years ago
 Hi there, there’s no out of the box way to do this yet in SciChart.js but we are discussing as a team how to do it. Best regards, Andrew
 Hi, I need the horizontal rollover modifier line. But without rotate the chart. like this XAxis.Alignment = Left and YAxis.Alignment = Top. I need the X axis must to be bottom and Y axis must to be left. How to display the horizontal line without rotate the chart?
- You must login to post comments
Ayana
Your vertical axis is Depth, am I right? Perhaps the vertical chart feature in SciChart.js will solve your problems?
Take a look at the Vertical Chart documentation.
const { wasmContext, sciChartSurface } = await SciChartSurface.create(divElementId);
const xAxis = new NumericAxis(wasmContext);
xAxis.axisAlignment = EAxisAlignment.Left; // Set XAxis alignment to the left or right
sciChartSurface.xAxes.add(xAxis);
const yAxis = new NumericAxis(wasmContext); // Set YAxis alignment to top or bottom
yAxis.axisAlignment = EAxisAlignment.Top;
sciChartSurface.yAxes.add(yAxis);
By setting XAxis.Alignment = Left and YAxis.Alignment = Top you rotate the chart. This also rotates modifiers like a RolloverModifier.
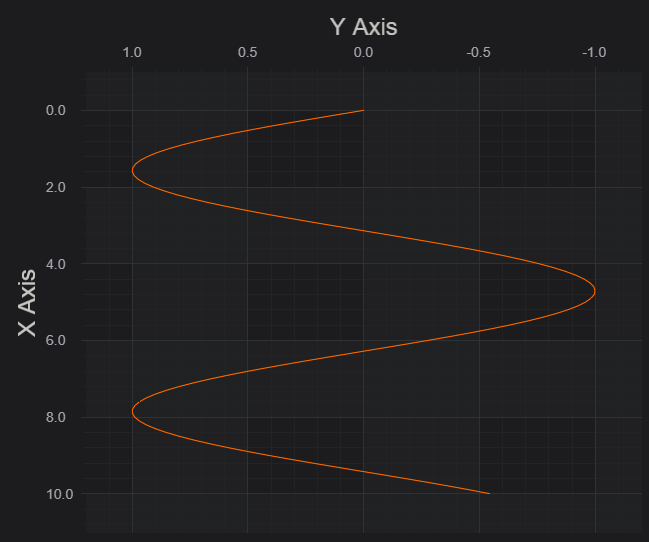
Also see our Vertical Chart demo which combines both.
Try it out!
Best regards
Andrew
- Andrew Burnett-Thompson answered 2 years ago
- You must login to post comments
Please login first to submit.
