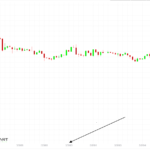
Hello I am using the following unixtimestamp format for the x axis and it renders some random numbers instead of treating them as dates. What is the correct format? please see attached screenshot.
export const dateValues: number[] = [
    1546300800000,
    1546304400000,
    1546308000000,
    1546311600000,
    1546315200000,
    1546318800000,
    1546322400000,
    1546326000000,
    1546329600000,
    1546333200000,
    1546336800000,
    1546340400000,
    1546344000000,
    1546347600000,
    1546351200000,
    1546354800000,
    1546358400000,
    1546362000000,
    1546365600000,
    1546369200000,
    1546372800000,
    1546376400000, ]
Here’s the code for creating the chart
  // Create a SciChartSurface
  const { sciChartSurface, wasmContext } = await SciChartSurface.create(
    "scichart-root"
  );

  sciChartSurface.xAxes.add(
        new CategoryAxis(wasmContext, {
          labelProvider: new SmartDateLabelProvider(),
          defaultXStep: 1546304400000 - 1546300800000,
          //growBy: new NumberRange(0.05, 0.05),
          drawMajorGridLines: true,
          drawMinorGridLines: true,
          axisAlignment: EAxisAlignment.Bottom,
          autoRange: EAutoRange.Once,
          drawMajorBands: false,
        })
      );
- mason jackson asked 2 years ago
- last edited 2 years ago
 Hi mason, how are you setting textformatting on the xaxis? What xaxis type are you using? Please share code how you’ve created the axis.
- You must login to post comments
// Create a SciChartSurface
  const { sciChartSurface, wasmContext } = await SciChartSurface.create(
    "scichart-root"
  );

  // Add an XAxis of type CategoryAxis - which collapses gaps in stock market data
  // SmartLabelProvider returns useful labels for stock market data
  sciChartSurface.xAxes.add(
    new CategoryAxis(wasmContext, {
      labelProvider: new SmartDateLabelProvider(),
      defaultXStep: 1546304400000 - 1546300800000,
      //growBy: new NumberRange(0.05, 0.05),
      drawMajorGridLines: true,
      drawMinorGridLines: true,
      axisAlignment: EAxisAlignment.Bottom,
      autoRange: EAutoRange.Once,
      drawMajorBands: false,
    })
  );
- mason jackson answered 2 years ago
 Hi Mason, I saw this, and edited your question to include the code. No need to post it again. Our team is working on this – so far they can’t reproduce (works here). I’ve asked the team to provide you with a working code sample that you can try out and modify to recreate the problem. best regards, Andrew
- You must login to post comments
Hello,
note that data series expect the xValues to be defined in Unix Timestamp format (number of seconds since 01/01/1970).
The data that you have provided seems to be defined in milliseconds.
So please check out this example, which should do just what you expect: https://codesandbox.io/s/practical-chandrasekhar-6uz5cf?file=/src/index.ts
Regards, Jim
- Jim Risen answered 2 years ago
 That’s a good point. What’s the desired outcome Mason? Are you trying to format from milliseconds to a time stamp? This could be possible with NumericAxis and a custom LabelProvider
- You must login to post comments
Please login first to submit.

