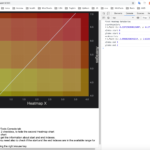
Hi, I’m looking for some pointers on how to implement the following:
- User draws a selection on the chart (similar to rubber band modifier)
- Annotation is drawn on the chart conforming to the users selection
- Annotation is fixed relative to the data point (e.g. will scroll is the chart is panned etc)
Many thanks
- You must login to post comments
Hi Henrique,
In order to draw a selection on a Heatmap chart and select data points you need to create a custom chart modifier.
Here you can find a Heatmap chart selection modifier example it selects datapoints and outputs min and max indexes into the browser console.
Moreover we have another custom modifier example for LineRenderableSeries.
Best regards,
Michael
- Michael Klishevich answered 3 years ago
 Thanks for this Michael. I’ve used this as a starting point: https://github.com/ABTSoftware/SciChart.JS.Examples/blob/master/Sandbox/CustomerExamples/SimpleDataPointSelectionModifier/src/SimpleDataPointSelectionModifier.ts Which works to a point. However it throws the following error when performed on a Heatmap: Error: getNativeXValues is invalid for heatmap type series. Try getting or setting zValues instead Could you advise?
- You must login to post comments
Please login first to submit.

