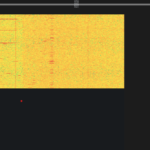
I am implementing a heatmap. The data size of the heatmap would be changed. I update the UniformHeatmapDataSeries with the updated zValues according to this post.
There is no problem if I update the UniformHeatmapDataSeries with a larger size zValues array. However, when I update it with a smaller size zValues array, the heatmap width will be decrease (Please refer to my screenshots). How can I keep the heatmap always 100% width?
- Quyen Sy asked 12 months ago
- You must login to post comments
Hi Quyen,
The Uniform Heatmap position, width and height is a function of the size of zValues[][] (2-dimensional) array and the xStart, xStep, yStart, yStep properties.
- So if you have 100×100 cells and xStart = 0, xStep = 1, yStart = 0, yStep = 2 then your heatmap will occupy 0..99 in the X direction and 0…199 in the Y direction.
- Change this to 200×200 cells with the same step then your heatmap will occupy 0..199 in the X direction and 0..399 in the Y direction
When you were creating a larger Heatmap it wasn’t correctly fitting the viewport, its probably larger than the viewport but you can’t see this because by default SciChart doesn’t zoom to fit new data unless you tell it too.
What I suggest you do is this:
- After resizing a heatmap, call SciChartSurface.zoomExtents() to zoom to fit the new heatmap bounds.
- This will make SciChart calculate the visibleRange of the X and Y axis to fit the new heatmap size, showing all your data
If that’s not the desired behaviour or if you want something else, let me know.
Best regards
Andrew
- Andrew Burnett-Thompson answered 12 months ago
 Thank Andrew! SciChartSurface.zoomExtents() fixed my problem.
- You must login to post comments
Please login first to submit.


