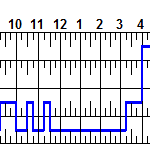
I wanted to use a stepline-box chart in my javascript applications for ELD, I failed to find out a similar box graph in the javascript chart section. The graph I have really looking for is attached here.
Could anyone please help me out?
- tomin thomas asked 3 years ago
- last edited 3 years ago
- You must login to post comments
Hi Thomas,
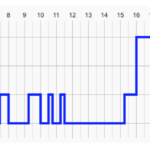
Sorry for the late reply. We do not have such a chart type, but it is possible to get a similar result with SciChart.js using Digital Line Chart, couple of Y Axes and AxisMarkerAnnotation.
Here I created a simple StepLineHoursOfServiceChart demo, which you can npm install and run. The screenshot of the chart I created is attached.
Best regards,
Michael
- Michael Klishevich answered 3 years ago
- You must login to post comments
Please login first to submit.


