I am considering applying server-side licensing for my javerScript application.
In the document below, there is a phrase “Our server-side licensing component is written in C++.”
(https://support.scichart.com/index.php?/Knowledgebase/Article/View/17256/42/)
However, there is only asp.net sample code on the provided github.
(https://github.com/ABTSoftware/SciChart.JS.Examples/tree/master/Sandbox/demo-dotnet-server-licensing)
I wonder if there is a sample code implemented in C++ for server-side licensing.
Can you provide c++ sample code?
Also, are there any examples to run on Ubuntu?
.PNG")
.PNG")
- samini retnam asked 2 years ago
- last edited 2 years ago
 This is a great question & an opportunity for us to demonstrate the flexibility of SciChart. I will talk to the team and get back to you. Best regards, Andrew
- Hi Samini, quick question, are you using React or Vue? We’re working on an example for you. Best regards, Andrew
 Good day; I am extremely sorry for the late response … I’m using React … Thank you …
- You must login to post comments
Hello,
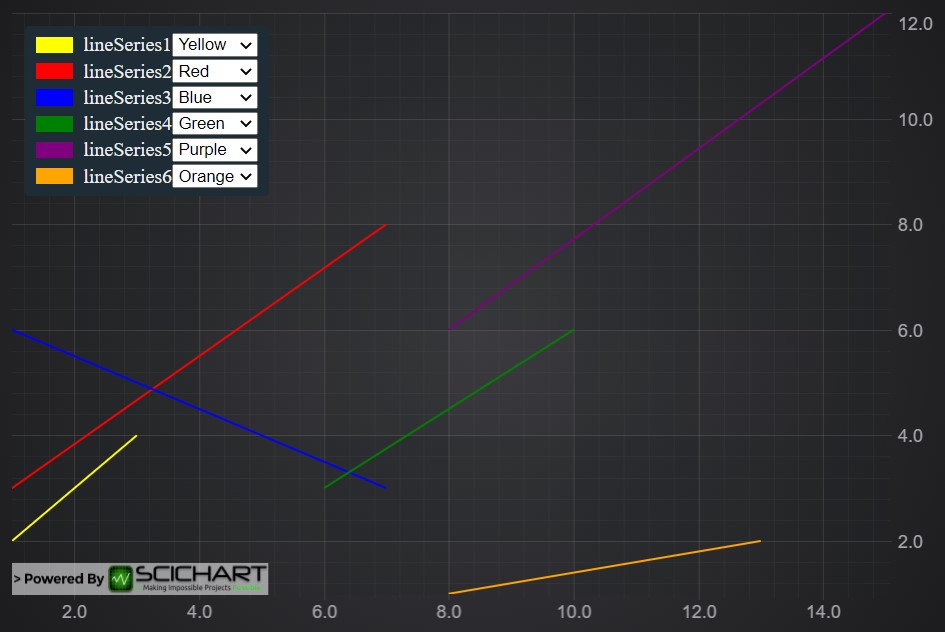
There are several options that you can use to make a custom legend in SciChart.js.
Method 1 – Custom Annotation
One of them as you mentioned is using a Custom Annotation and adding HTML directly into an SVG template.
Here is an example on our Github: Annotations example.
Method 2 – Custom Legend class
Another one is to create a Custom Legend by overriding a method for generating an inner HTML string.
Here’s a code example on CodeSandbox
const legendModifier = new LegendModifier({});
 // @ts-ignore
window.changeStroke = function changeSeriesStroke(seriesId: string) {
const series = sciChartSurface.renderableSeries.getById(seriesId);
const selector = document.getElementById(
  `${seriesId}-color-selector`
) as HTMLSelectElement;
const colorValue = selector?.value;
series.stroke = colorValue;
selector.value = colorValue;
// make sure that legend is updated and show proper color label
legendModifier.sciChartLegend.invalidateLegend();
};
const getHtmlForSeries = (series: FastLineRenderableSeries): string => {
let str = `<span class="scichart__legend-item" style="display: flex; align-items: center; margin-right: 4px; white-space: nowrap;">`;
str += `<label for="${series.id}" style="background-color: ${series.stroke}; margin: 4px; width: 30px; height: 13px;"></label>`;
str += `<label for="${series.id}" style="margin-left: 4px;">${series.id}</label>`;
str += `<select id="${series.id}-color-selector" onchange="changeStroke('${
  series.id
}')" name="colors">
      <option ${
        series.stroke === "Blue" ? "selected" : ""
      } value="Blue">Blue</option>
      <option ${
        series.stroke === "Green" ? "selected" : ""
      } value="Green">Green</option>
      <option ${series.stroke === "Red" ? "selected" : ""}
        value="Red">Red</option>
      <option ${
        series.stroke === "Yellow" ? "selected" : ""
      } value="Yellow">Yellow</option>
      <option ${
        series.stroke === "Orange" ? "selected" : ""
      } value="Yellow">Orange</option>
      <option ${
        series.stroke === "Purple" ? "selected" : ""
      } value="Yellow">Purple</option>
  </select>`;
str += `</span>`;
return str;
};
class CustomLegendControl extends SciChartLegend {
public getLegendHTML(
  placement: ELegendPlacement,
  textColor: string,
  backgroundColor: string,
  margin: Thickness,
  orientation: ELegendOrientation,
  showCheckboxes: boolean,
  showSeriesMarkers: boolean,
  items: TLegendItem[]
): string {
  let body = "";
  sciChartSurface.renderableSeries
    .asArray()
    .forEach((series: IRenderableSeries) => {
      body += getHtmlForSeries(series as FastLineRenderableSeries);
    });
return getLegendContainerHtml(
    placement,
    textColor,
    backgroundColor,
    margin,
    body
  );
}
}
legendModifier.sciChartLegend = new CustomLegendControl();
sciChartSurface.chartModifiers.add(legendModifier);
Method 3- React Example
Or alternatively, you can simply reference the chart from your Custom Control.
Here’s another Code sandbox example
Then you can apply proper positioning accordingly to your use case ( e.g. by using sciChartSurface.seriesViewRect as a base container)
- Jim Risen answered 2 years ago
- last edited 2 years ago
- You must login to post comments
Please login first to submit.
