I am working on a proof of concept for our company to move some of our desktop apps to the web. We use SciChart WPF in our desktop apps so we are going with SciChart.JS for the web apps. Is it possible to stack the FastLineRenderableSeries in SciChart.JS like we do in WPF?
Edit: Found the answer just after I posted this question.
sciChartSurface.layoutManager.leftOuterAxesLayoutStrategy = new LeftAlignedOuterVerticallyStackedAxisLayoutStrategy();
- Tim Stephansen asked 2 years ago
- last edited 2 years ago
- You must login to post comments
Thanks for the additional info Andrew; I was hoping to avoid a second chart as it will complicate some things in already-messy javascript, but the synchronization feature is nice. I remember that from the WPF charts from long ago
- Dan Santimore answered 6 months ago
 Hi Dan, we don’t have the ability to clip series to their respective axis ranges in Vertically Stacked Axis scenario (in fact: not clipping is a feature not a bug), however we may be able to add this in future. Thanks for the suggestion
 Really appreciate the quick addition of this option Andrew and David!
- You must login to post comments
Hi Dan
Having two charts, two X/Y Axis stacked one above each other, but sharing zooming, panning and cursors is a feature which has been in SciChart.js from day #1
See the tutorial here on ‘Synchronising Multiple Charts‘
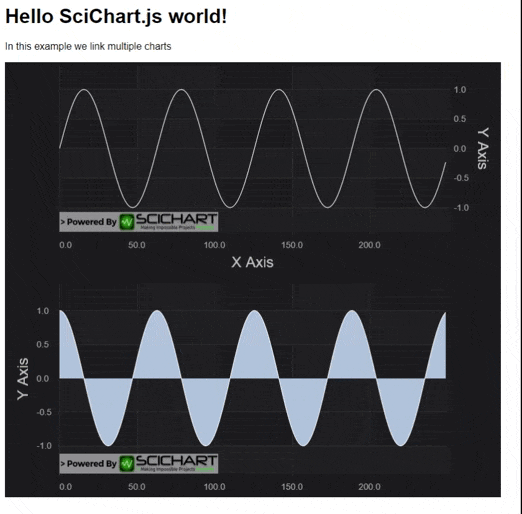
How this works:
– Create two SciChartSurfaces using SciChartSurface.create() into two separate <div> which are located one above another
– Use the SciChartVerticalGroup feature to synchronise axis sizes
– Use the ChartModifier modifierGroup feature to synchronise mouse events
– Use axis.visibleRange callbacks to synchronise zooming, panning
The tutorial above explains all.
For a concrete demonstration, this one in SciChart.js demo – Multi Pane Stock Charts – uses this technique
We are in the process of creating more demos to highlight this feature as it seems not many are aware of it!
Best regards
Andrew
- Andrew Burnett-Thompson answered 6 months ago
- You must login to post comments
Hi Dan,
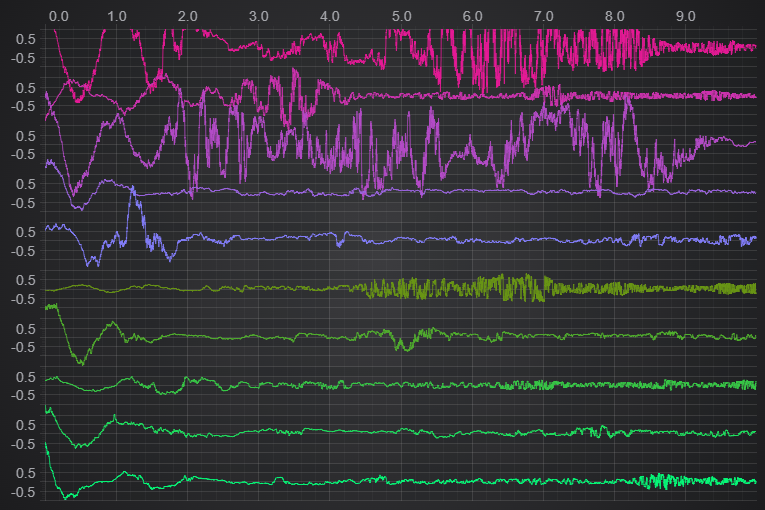
We just released Scichart.js v3.2.509 which includes a clipToYRange property on renderableSeries. Set this true if you have vertically stacked axes and want to clip to the visible range of the axis.
Full changelog at https://www.scichart.com/cbxchangelog/scichart-js-changelog/
Regards
David
- David Burleigh answered 6 months ago
- last edited 6 months ago
- You must login to post comments
Hi Tim
Yes it is, I’m glad you found the answer in our JS Chart Documentation.
The Vertically Stacked Axis exists in SciChart.js
So does Horizontally Stacked Axis
There are actually more configuration options for scichart.js than for WPF for axis alignment.
Let us know if you have further questions
Best regards
Andrew
- Andrew Burnett-Thompson answered 2 years ago
- You must login to post comments
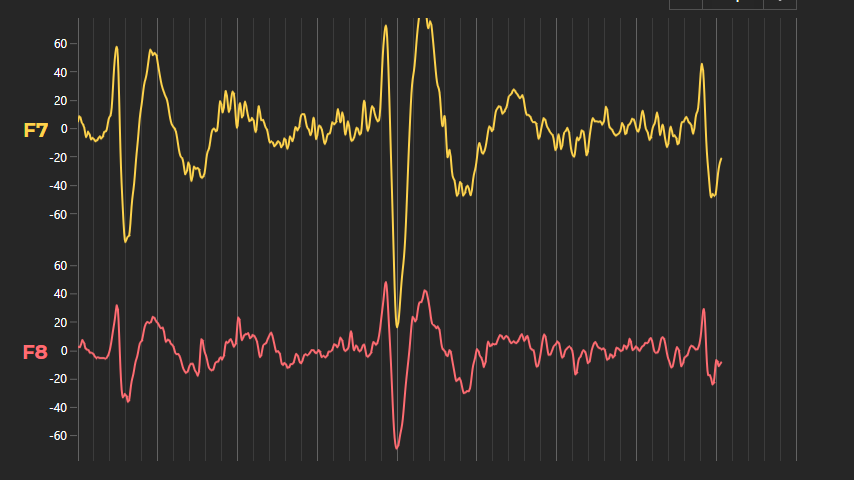
I know this is an old one, but because it’s a relevant follow-up on this feature in scichart-js — I loved how easy it was to to using stacked axes like this. However, my client would strongly prefer that plot lines not “bleed” between stacked axes (in my use case,I’ve just taken a typically right-aligned Y2 and left-aligned it with your layout manager).
I’m guessing having pseduo-separated plots using the layout manager like this isn’t easily achievable and I should really think about separate plots?
- Dan Santimore answered 6 months ago
- last edited 6 months ago
- Hi Dan, see my latest answer below
- You must login to post comments
Please login first to submit.
