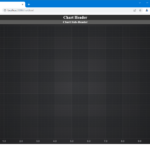
I have combed through KB articles and other documentations and samples here and SO, but I am not able to fix the issue. I am desperate for any help.
I have a react app that shows the chart, but at the top of the page, I have a header section and the remaining height is filled with Chart. All the samples and answers that I have seen thus far has no header section on the page. So the chart is 100% filled within it’s container. But, in my case the chart does not fit its container width & height and I end up with a scroll-bar. This is especially evident when you maximize the page (Chrome maximize window).
I am on Windows 10.
I have attached the code and a screen-shot of what the resulting page in Chrome. I have tried with and without CSS and it made no difference in terms of chart filling its container.
React Code:
import { useCallback, useEffect, useState } from 'react';
import { createRoot } from 'react-dom/client';
import './Chart-styles.scss';
import { SciChartSurface } from 'scichart/Charting/Visuals/SciChartSurface';
import { NumericAxis } from 'scichart/Charting/Visuals/Axis/NumericAxis';
import { getSciChartLicense } from '../common/chartUtils';

const Chart = () => {
const [chartId] = useState('line-chart');

const initChartAsync = useCallback(async () => {
    const { sciChartSurface, wasmContext } = await SciChartSurface.create(chartId);

    const xAxis = new NumericAxis(wasmContext);
    const yAxis = new NumericAxis(wasmContext);
    sciChartSurface.xAxes.add(xAxis);
    sciChartSurface.yAxes.add(yAxis);
}, []);

useEffect(() => {
    SciChartSurface.setRuntimeLicenseKey(getSciChartLicense());
    initChartAsync()
        .catch(error => {
            console.error('ChartRenderer | useEffect | initChartAsync failed!', error);
        });
}, [chartId]);

return (
    <div className="App">
        <div className='App-header'>
            <h2>Chart Header</h2>
            <h3>Chart Sub-Header</h3>
        </div>
        <div
            id={chartId}
            style={{width: '100%', height: '100%'}}
        />
    </div>
);
};

const container = document.getElementById('app');
const root = createRoot(container!);
root.render(<Chart/>);
Chart-Style.scss
#app {
    display: flex;
    flex-flow: column nowrap;
    margin: 0;
    padding: 0;
}

.App {
    flex: 1 1 auto;
    display: flex;
    flex-flow: column nowrap;
    text-align: center;
}

.App-header {
    flex: 0 1 auto;
    display: flex;
    flex-flow: column nowrap;
    background-color: #855b24;
    color: white;
    h2 {
        background-color: #2e2e2d;
        flex: 0 1 auto;
        margin: 0;
        padding: 2px;
    }
    h3 {
        background-color: #5c5c5b;
        flex: 0 1 auto;
        margin: 0;
        padding: 2px;
    }
}

#line-chart {
    flex: 1 1 auto;
}
- sachin patel asked 2 years ago
- last edited 2 years ago
 Hello, I believe you should check out this “disableAspect” property https://www.scichart.com/documentation/js/current/typedoc/interfaces/i2dsurfaceoptions.html#disableaspect So I would suggest setting it to `false` and then try setting some limits to the chart root container with height and max-height properties. E.g. : const { sciChartSurface, wasmContext } = await SciChartSurface.create( chartId, {disableAspect: false} ); Also, consider if you really want the chart root element to take up 100% of the parent container. Let us know if that helped.
 I have tried setting `disableAspect: false` but that did not fill the chart to 100% of the div height. If you have a *working* sample (with headers at the top), then please post that here and I will be happy to try it out. YES, the app I am developing requires the chart to fill 100% of div’s remaining height and width when I resize the container that the chart lives in.
- You must login to post comments
Hi Sachin,
Here are minimal updates required to achieve this
 <div className="App"  style={{height: "100vh"}}>
        <div className='App-header'>
            <h2>Chart Header</h2>
            <h3>Chart Sub-Header</h3>
        </div>
        <div style={{flex: "auto"}}>
        <div
            id={chartId}
            style={{width: '100%', height: "100%",  maxHeight: "100%"}}
        />
        </div>
    </div>
Hope this works for you. Let us know if it was helpful.
- Ivan Gasyuk answered 2 years ago
- You must login to post comments
It still does not work. I have uploaded a video on YouTube that shows the issue. The source-code and stylesheet (scss) is visible in the video as well.
For some reason I am not able to attach the source-code and stylesheet in case you want to try it out yourself to replicate the issue.
Here is the link to the video:
https://www.youtube.com/watch?v=IilYkpcxXLI
Chart.tsx
import { useEffect, useState } from 'react';
import { createRoot } from 'react-dom/client';
import './Chart-styles.scss';
import { SciChartSurface } from 'scichart/Charting/Visuals/SciChartSurface';
import { NumericAxis } from 'scichart/Charting/Visuals/Axis/NumericAxis';
import { getSciChartLicense } from '../common/chartUtils';

const Chart = () => {
const [chartId] = useState('line-chart');

useEffect(() => {
    async function initChartAsync() {
        const { sciChartSurface, wasmContext } = await SciChartSurface.create(chartId);

        const xAxis = new NumericAxis(wasmContext);
        const yAxis = new NumericAxis(wasmContext);
        sciChartSurface.xAxes.add(xAxis);
        sciChartSurface.yAxes.add(yAxis);
    }

    SciChartSurface.setRuntimeLicenseKey(getSciChartLicense());

    initChartAsync().catch((error) => {
        console.error('ChartRenderer | useEffect | initChartAsync failed!', error);
    });
}, [chartId]);

return (
    <>
        <div className="App-header">
            <h2>Chart Header</h2>
            <h3>Chart Sub-Header</h3>
        </div>
        <div className="chart-container-wrapper" style={{ flex: 'auto' }}>
            <div id={chartId} style={{ width: '100%', height: '100%', maxHeight: '100%' }} />
        </div>
    </>
);
};

const container = document.getElementById('app');
if (!container) {
    throw Error(`cannot find container with id = 'app'`);
}

const root = createRoot(container);
root.render(<Chart />);


**Chart-styles.scss**


header {
    margin: 0;
    padding: 0;
}

body {
    margin: 0;
    padding: 0;
    background-color: rgb(3, 61, 61);
}

#app {
    height: 100vh;
    display: flex;
    flex-flow: column nowrap;
    align-items: stretch;
    text-align: center;
    background-color: rgb(127, 175, 175);
}

.App-header {
    flex: 0 1 auto;
    display: flex;
    flex-flow: column nowrap;
    background-color: #855b24;
    color: white;
    h2 {
        margin: 0;
        padding: 5px 0;
        background-color: #585857;
    }
    h3 {
        margin: 0;
        padding: 5px 0;
    }
}
Best Regards,
Sachin Patel.
- sachin patel answered 2 years ago
- last edited 2 years ago
- You must login to post comments
Hello,
Try setting “overflow: hidden” to the “chart-container-wrapper”.
- Jim Risen answered 2 years ago
- last edited 2 years ago
- You must login to post comments
Please login first to submit.


