Hi,
I’ve had a request from the client of our app to set logarithmic axis to have their major ticks at powers of 10, for example 0.1|1|10|100|1000|10000 – they would be expressed as 1e-1|1e0|1e1|1e2|1e3|1e4…. etc.
Is this possible within the current implantation of the logarithmic axis?
Cheers,
- Adam Stone asked 2 years ago
- You must login to post comments
OK so you need another API to control the frequency of tick labels
Try this: Axis Ticks – Gridline and Label Spacing (Interval)
Axis.majorDelta and minorDelta will give you coarse grain control over the output ticks (labels) on an axis.
- For a non-log NumericAxis a majorDelta = 1 means “Place a label at every 1”
- For logarithmic axis with logBase = 10, majorDelta = 1 means “Place a label at every 10^1”
You can also have precise control over the axis ticks using the TickProvider API.
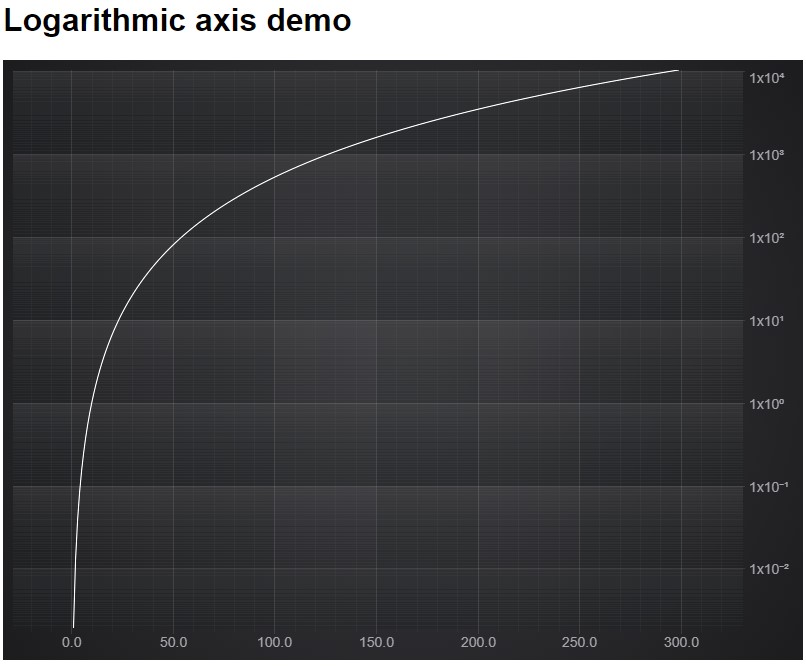
I’ve updated the Logarithmic Axis example here to include these two features.
const yAxis = new LogarithmicAxis(wasmContext, {
    logBase: 10,
    labelFormat: ENumericFormat.Scientific,
    majorDelta: 1,
    minorDelta: 0.1,
    autoTicks: false, // When true, calculate major/minor delta. Otherwise use user-provided values
});
This results in the following output
Best regards
Andrew
- Andrew Burnett-Thompson answered 2 years ago
- You must login to post comments
Hi Adam,
yes it is, we call this scientific notation. Take a look at the JavaScript Logarithmic Axis documentation.
import {SciChartSurface} from "scichart/Charting/Visuals/SciChartSurface";
import {EAxisAlignment} from "scichart/types/AxisAlignment";
import {ENumericFormat} from "scichart/types/NumericFormat";
import {LogarithmicAxis} from "scichart/Charting/Visuals/Axis/LogarithmicAxis";
import {NumberRange} from "scichart/Core/NumberRange";
sciChartSurface.xAxes.add(new LogarithmicAxis(wasmContext, {
    axisTitle: "Log(10) Axis",
    axisAlignment: EAxisAlignment.Bottom,
    labelFormat: ENumericFormat.Scientific,
    logBase: 10,
    visibleRange: new NumberRange(1, 1E6)
}));
By specifying labelFormat = ENumericFormat.Scientific and logBase = 10, you will get numbers formatted as 1×10^1, 1×10^2
With ENumericFormat.Exponential you will get numbers formatted as 1E0, 1E1, 1E2
Does this help?
Best regards
Andrew
- Andrew Burnett-Thompson answered 2 years ago
- You must login to post comments
Hi Andrew,
Thanks for your response. I’ve recreated this in our product and it’s almost what I needed. I’ve attached a screenshot that shows what it’s produced with our data. Whilst I can see the 1x10x1 1x10x0 etc I also get 3x10xX in-between each of those ticks. The same happens with Exponential with the 3.2e-X marks. Is there a way to force the chart to omit this and always stick with 1e/1×10 ticks?
I’ve also tried experimenting with the ELogarithmicMajorTickMode and ELogarithmicMinorTickModes but unless I’ve misunderstood them I’m unable to reproduce what I need.
Regards,
Adam


- Adam Stone answered 2 years ago
- last edited 2 years ago
- You must login to post comments
Perfect, thank you so much for your help.
- Adam Stone answered 2 years ago
- You must login to post comments
Please login first to submit.
