I am wondering if there may be some guidance on how to configure the styles for the SciChart.js chart instance in a React application to be able to handle dynamic changes to the height value.
The scenario is that the chart and wasm context are being saved in refs, so that the component the chart exists within does not rerender. Data is being consumed via a web socket, and streaming realtime data.
All that is well and good, but trying to implement a new feature request where the height of the chart changes dynamically, similar to an accordion style where the chart may have a full view, a split view, or no view (92vh, 46vh, 0vh)
I am finding that my css styles are not applying, or frustratingly will apply seemingly at random and other times not apply even though the underlying code remains the same. I tried to override, or at least alter, the position absolute styles of the canvas, by wrapping it in a parent element with position relative, which works to keep the height and width of the chart as desired, but the aspect ratio seems to falter and the chart axes are blurred and illegible.
I’m sure this would be a great instance of a picture says a 1000 words, and I am nearing a 1000 words. Will try to attach a codepen/ example that demonstrates the issue I am experiencing.
If there are any tips or tricks you would recommend please advise
- James Miller asked 3 years ago
- You must login to post comments
Hi James,
The SciChartSurface takes all the space of the parent div element. Therefore if you need to change the chart size dynamically you need to change the parent div element dynamically.
Let’s say you have this html
<div id="scichart-container" style="height: 100vh;">
        <!-- the Div where the SciChartSurface will reside -->
        <div id="scichart-root" style="width: 100%; height:100%;"></div>
</div>
with a SciChartSurface which only has two axes and no data.
const { sciChartSurface, wasmContext } = await SciChartSurface.create("scichart-root");

// Create an X,Y Axis and add to the chart
const xAxis = new NumericAxis(wasmContext, { visibleRange: new NumberRange(0, 10) });
const yAxis = new NumericAxis(wasmContext, { visibleRange: new NumberRange(0, 10) });

sciChartSurface.xAxes.add(xAxis);
sciChartSurface.yAxes.add(yAxis);
This will produce a chart that takes the whole window.
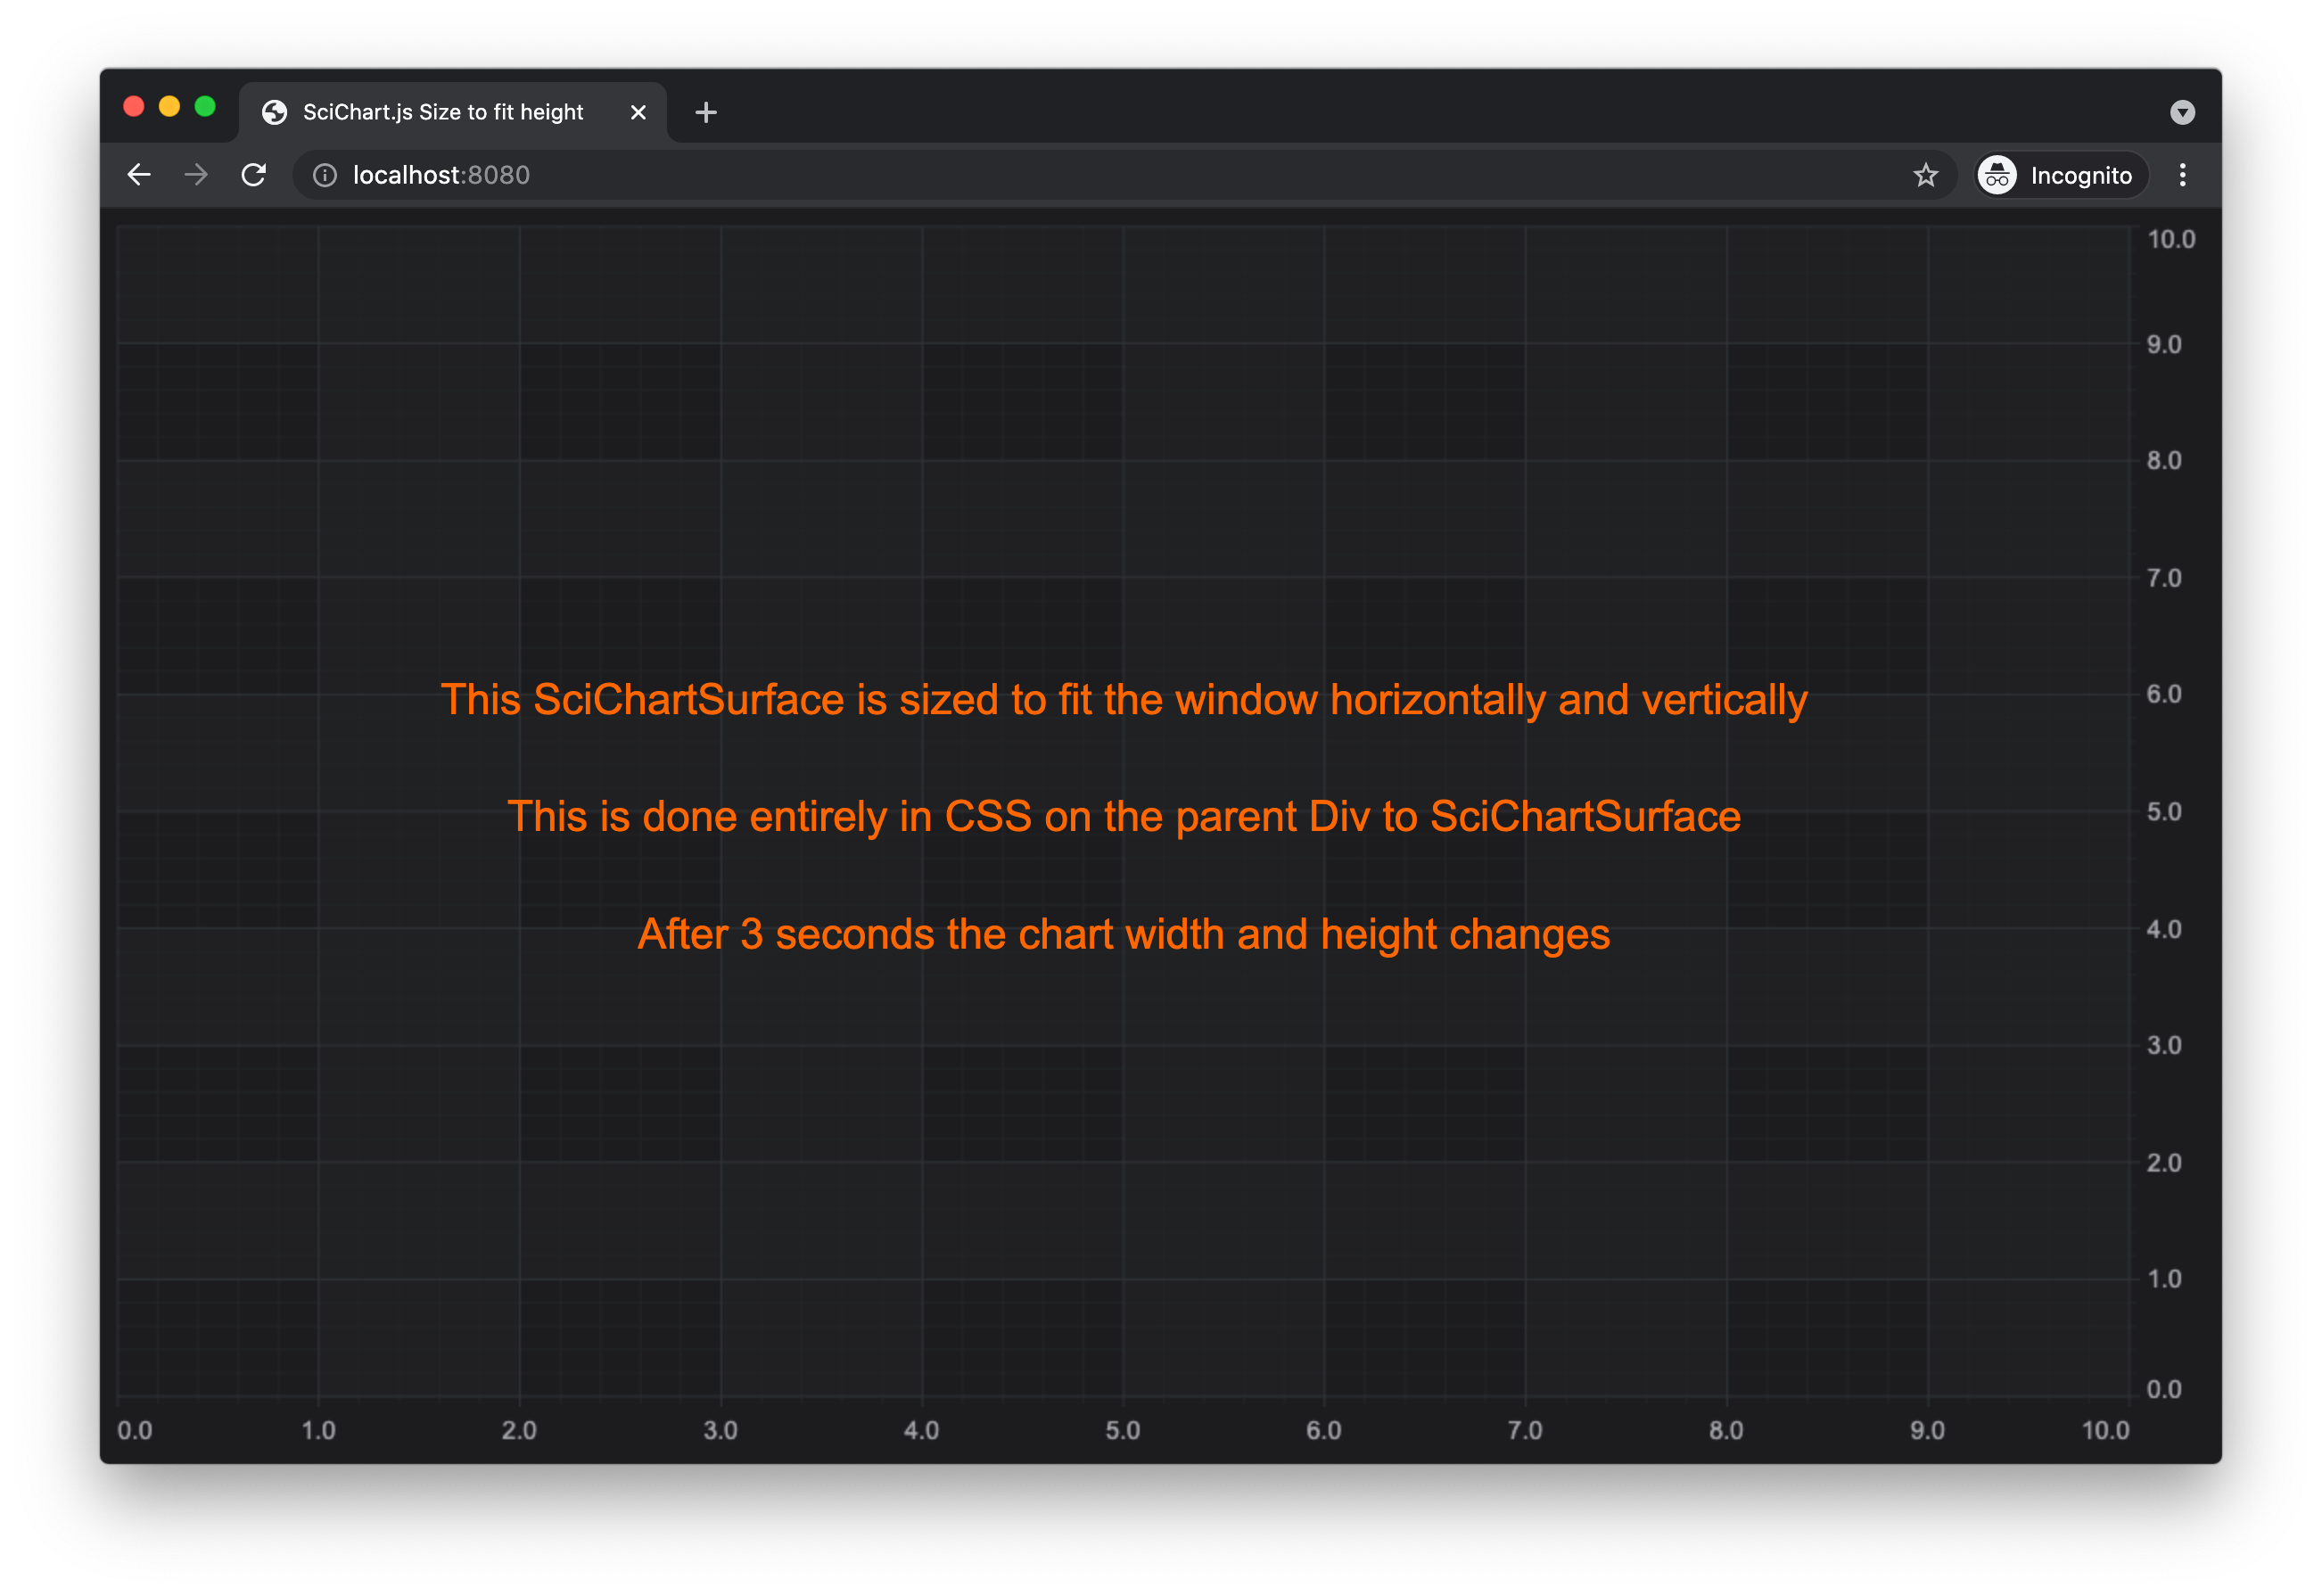
Adding this setTimeout will change the size dynamically and set it to fixed width and height 900px*600px after 3 seconds.
setTimeout(() => {
    console.log("changing the chart height and width dynamically");
    const chartContainer = document.getElementById("scichart-container");
    chartContainer.style.height = "600px";
    chartContainer.style.width = "900px";
}, 3000);
You will find a sample project to change width and height dynamically here
- Michael Klishevich answered 3 years ago
- last edited 3 years ago
- You must login to post comments
Please login first to submit.
