I have a simple need to display a horizontal heatmap based on values along the x-axis. So if value on x-axis is 1, color shown on the heatmap should be orange, if the next value is 2, red color bar appears to next the previous orange etc. Something like this (see attached graphic also):
Heatmap: [=orange=red=green]
values along x-axis: [22.05, 24.00, 30.00 ]
So the code I am trying is as follows:
export async function renderHeatMap(element)
{
    const { sciChartSurface, wasmContext } = await SciChartSurface.create(element);

    sciChartSurface.xAxes.add(new NumericAxis(wasmContext));
    sciChartSurface.yAxes.add(new NumericAxis(wasmContext));

    var heatMapData = zeroArray2D([1, 5]);
    heatMapData[0][0] = 22.05; //should appear as color1 in heatmap
    heatMapData[0][1] = 24.00; //...
    heatMapData[0][2] = 30.00; //should appear as color2 in heatmap
    heatMapData[0][3] = 26.75;
    heatMapData[0][4] = 30.00; //should appear as color3 in heatmap

    const heatmapDataSeries = new UniformHeatmapDataSeries(wasmContext, 0, 1, 0, 1, heatMapData);

    const heatmapSeries = new UniformHeatmapRenderableSeries(wasmContext, {
        dataSeries: heatmapDataSeries,
        colorMap: new HeatmapColorMap({
            minimum: 20, // min value in the zValues (data) to map to offset 0 in the colormap
            maximum: 30, // max value in the zValues (data) to map to offset 1 in the colormap
            gradientStops: [
                { offset: 0, color: "#00008B" },
                { offset: 0.3, color: "#7FFF00" },
                { offset: 0.7, color: "#FFFF00" },
                { offset: 1.0, color: "#FF0000" },
            ],
        }),
    });

    sciChartSurface.renderableSeries.add(heatmapSeries);
}
But this only displays an empty grid. I don’t see a heatmap. Anyone can point out what may be wrong? Not even the axis is showing up correctly.


- Joel Roberts asked 2 years ago
- last edited 2 years ago
- You must login to post comments
Thanks, that solved my first problem.
- Joel Roberts answered 2 years ago
- last edited 2 years ago
 Great, and the second?
- You must login to post comments
This answer is now expanded on in a blog post titled How to show 1D colored horizontal bar on a JavaScript Chart
Hi Joel
I tried running this code sample & got an error in the Javascript file here:
const heatmapDataSeries = new UniformHeatmapDataSeries(wasmContext, 0, 1, 0, 1, heatMapData);
This should be this code instead:
const heatmapDataSeries = new UniformHeatmapDataSeries(wasmContext, {
    xStart: 0,
    xStep: 1,
    yStart: 0,
    yStep: 1,
    zValues: heatMapData
});
When I make this change I get the following output on screen:
My full code is here.
import {SciChartSurface} from "scichart/Charting/Visuals/SciChartSurface";
import {NumericAxis} from "scichart/Charting/Visuals/Axis/NumericAxis";
import {zeroArray2D} from "scichart/utils/zeroArray2D";
import {UniformHeatmapDataSeries} from "scichart/Charting/Model/UniformHeatmapDataSeries";
import {UniformHeatmapRenderableSeries} from "scichart/Charting/Visuals/RenderableSeries/UniformHeatmapRenderableSeries";
import {HeatmapColorMap} from "scichart/Charting/Visuals/RenderableSeries/HeatmapColorMap";
import {NumberRange} from "scichart/Core/NumberRange";

async function initSciChart() {
    // LICENSING //
    // Set your license code here
    // You can get a trial license key from https://www.scichart.com/licensing-scichart-js/
    // Purchased license keys can be viewed at https://www.scichart.com/profile
    //
    // e.g.
    //
    // SciChartSurface.setRuntimeLicenseKey("YOUR_RUNTIME_KEY");
    //
    // Also, once activated (trial or paid license) having the licensing wizard open on your machine
    // will mean any or all applications you run locally will be fully licensed.

    // Create the SciChartSurface in the div 'scichart-root'
    // The SciChartSurface, and webassembly context 'wasmContext' are paired. This wasmContext
    // instance must be passed to other types that exist on the same surface.
    const { sciChartSurface, wasmContext } = await SciChartSurface.create("scichart-root");

    sciChartSurface.xAxes.add(new NumericAxis(wasmContext));
    sciChartSurface.yAxes.add(new NumericAxis(wasmContext, {
        visibleRange: new NumberRange(0, 10)
    }));

    const heatMapData = zeroArray2D([1, 5]);
    heatMapData[0][0] = 22.05; //should appear as color1 in heatmap
    heatMapData[0][2] = 24.00; //...
    heatMapData[0][3] = 30.00; //should appear as color2 in heatmap
    heatMapData[0][4] = 26.75;
    heatMapData[0][4] = 30.00; //should appear as color3 in heatmap

    const heatmapDataSeries = new UniformHeatmapDataSeries(wasmContext, {
        xStart: 0,
        xStep: 1,
        yStart: 0,
        yStep: 1,
        zValues: heatMapData
    });

    const heatmapSeries = new UniformHeatmapRenderableSeries(wasmContext, {
        dataSeries: heatmapDataSeries,
        colorMap: new HeatmapColorMap({
            minimum: 20, // min value in the zValues (data) to map to offset 0 in the colormap
            maximum: 30, // max value in the zValues (data) to map to offset 1 in the colormap
            gradientStops: [
                { offset: 0, color: "#00008B" },
                { offset: 0.3, color: "#7FFF00" },
                { offset: 0.7, color: "#FFFF00" },
                { offset: 1.0, color: "#FF0000" },
            ],
        }),
    });

    sciChartSurface.renderableSeries.add(heatmapSeries);
}

initSciChart();
Can you try this? Does this help?
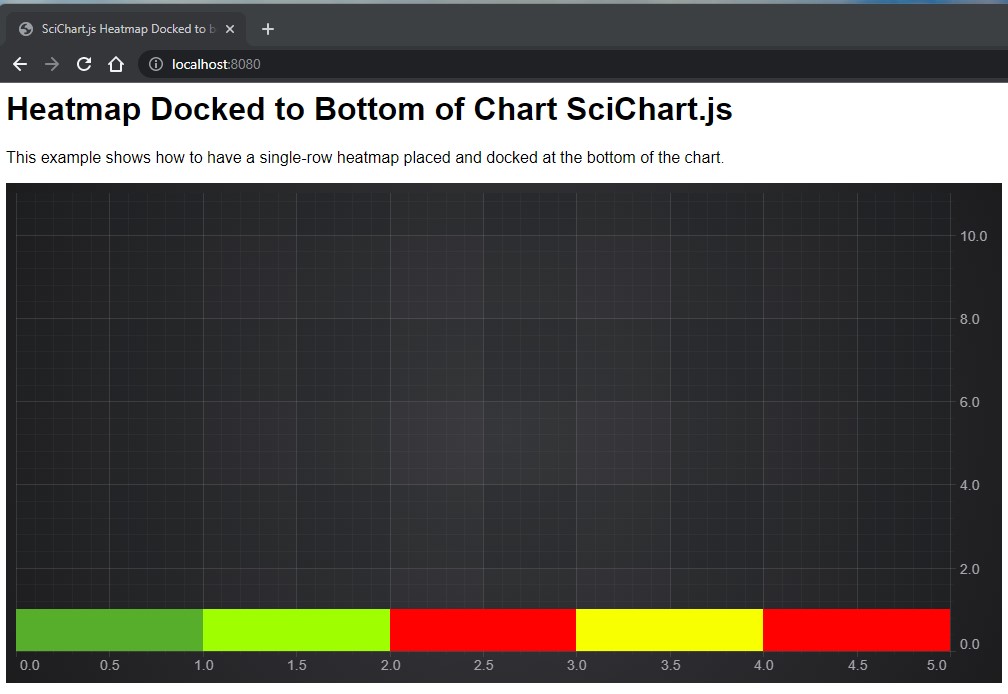
Note: I also managed to get the heatmap docking to the bottom of the chart by hacking/overriding heatmapDataSeries.getYRange()
// OPTIONAL:
// Override HeatmapDataSeries.getYRange() to always return the bottom 5% of the chart
// NOTE: Use this with caution as DataSeries.getYRange() is also used in the yAxis autorange algorothm
// so you will need to specify a visiblerange on the yaxis or have other series as well.
heatmapDataSeries.getYRange = () => {
    return new NumberRange(yAxis.visibleRange.min, yAxis.visibleRange.diff * 0.05 + yAxis.visibleRange.min);
};
This causes the heatmap to always be positioned at the bottom of the chart, regardless of zoom on the YAxis.
Full code sample here:
Best regards
Andrew
- Andrew Burnett-Thompson answered 2 years ago
- last edited 4 months ago
- You must login to post comments
Please login first to submit.
