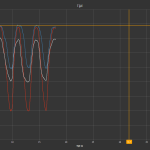
Hi,
I’m using 2 annotation markers, one horizontal and one vertical.
In xaml:
            <SciChart:SciChartSurface.Annotations>
                <SciChart:HorizontalLineAnnotation HorizontalAlignment="Stretch" IsEditable="True" LabelPlacement="Axis" LabelTextFormatting="0.0" ShowLabel="True" Stroke="Orange" StrokeThickness="2" Y1="{Binding Path=UpRightMarkerYPos, Mode=TwoWay}" IsHidden="{Binding Path=TimeChartMarkerIsHidden}"/>
                <SciChart:VerticalLineAnnotation VerticalAlignment="Stretch" IsEditable="True" LabelPlacement="Axis" LabelTextFormatting="0.0" ShowLabel="True" Stroke="Orange" StrokeThickness="2" X1="{Binding Path=BowMarkerXPos, Mode=TwoWay}" IsHidden="{Binding Path=TimeChartMarkerIsHidden}"/>
            </SciChart:SciChartSurface.Annotations>
I’ve set the LabelPlacement on Axis, so I expect that the labels will not be drawn over the graphical data.
It works fine for the Vertical one, but the horizontal marker will display the label over the data, so I can’t see a part of my graph anymore.
How can I position the label so it will not be on top of the graphical data?
Thanks,
Egbert
- EJansen asked 11 years ago
- You must login to post comments
Hi there,
This is by-design behavior, which prevents labels to be clipped if they’re wider then the axis they are placed on. But you can work around it in such a way:
                <s:HorizontalLineAnnotation HorizontalAlignment="Stretch"
                                            IsEditable="True"
                                            StrokeThickness="2"
                                            Y1="..."
...>
 <!-- add small offset as a workaround -->
                    <s:AnnotationLabel LabelPlacement="Axis"
                                       TextFormatting="0.0"
                                       Canvas.Left="-5"/>
                </s:HorizontalLineAnnotation>
Or you can rotate the label:
                <s:HorizontalLineAnnotation HorizontalAlignment="Stretch"
                                            IsEditable="True"
                                            StrokeThickness="2"
                                            Y1="...">
                    <s:AnnotationLabel LabelPlacement="Axis"
                                       TextFormatting="0.0"
                                       RotationAngle="90"
                                       Canvas.Right="0"/>
                </s:HorizontalLineAnnotation>
Please, let us know if any of these is suitable for you,
Best regards,
Yuriy
- Yuriy Zadereckiy answered 11 years ago
 Hi, It could be an option if it works, but now the formatting does not work anymore... (see attachments) Best regards, Egbert
 Hi Egbert, You should set ShowLabel="False"(by default) from annotations definitions to prevent second label from being shown. Now you have two overlapped labels, the first is automatically created by ShowLabel="True", and the second is created explicitly in the markup I post above. Hope this helps! Best regards, Yuriy
- You must login to post comments
Please login first to submit.

