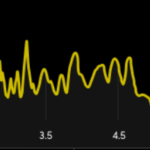
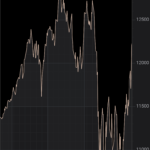
Hi,
I have a question as to whether it is possible to draw major gridlines to end at the renderSeries surface. Something similar to the attached image.
- You must login to post comments
Hi Vidya,
It isn’t possible because chart’s XAxis doesn’t have direct access to data from renderable series. Have you tried to use FastMountainRenderableSeries instead?
You can set its fill to some non transparent color ( so fill color will replace gridlines ) and set its ZeroLineY to some high enough value ( larger than VisibleRange.Max for YAxis ):
   final FastMountainRenderableSeries rSeries = sciChartBuilder.newMountainSeries()
            .withDataSeries(dataSeries)
            .withStrokeStyle(0xAAFFC9A8, 1f, true)
            .withAreaFillColor(Color.BLACK)
            .withZeroLine(13000)
            .build();
Is this suitable for your needs? Hope this will help you!
Best regards,
Yura
- Yura Khariton answered 5 years ago
 Also on the side note when you enable labels you get the bottom x axis line above the label right. Is there any way to remove that but still keep the label?
 I believe you’re talking about border for area where renderable series are drawn, right? If yes, then you can customize it’s color ( make it transparent ) by extending one of default or creating new theme for chart ( https://www.scichart.com/example/android-chart-example-create-a-custom-theme/ – you’ll need to change renderableSeriesAreaBorderColor value )
 Also you can set border style directly on chart instance ( https://www.scichart.com/documentation/android/v2.x/webframe.html#topic1188.html )
 Yes, but it also extends the gridline. Is it possible to stop the gridline before the label?
 Nvm found it myself. Thanks for the help on the border, gridlines. I was setting the axis as centre axis removing that and the alignment solved it
- 6 more comments
- You must login to post comments
Please login first to submit.


