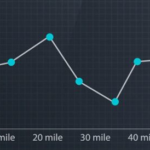
Is it possible to give an arrow type style to the axes? As seen in the attached image.
It would be perfect!
Otherwise, I would like to know if it is not possible, not to take into account this characteristic in my development.
I hope you can give me a clue please. Thanks in advance.
- Julio Olivos asked 7 years ago
- You must login to post comments
Hi Julio,
Well SciChart.Android does not support such drawing out of the box for now but you customize chart and add desired behavior on your own.
For example you can use LineArrowAnnotation to draw these arrows but you’ll need to slightly modify this annotation type to prevent clipping because by default it is clipped to annotation surface ( rectangular area where renderable series are drawn ):
 public class LineArrowAnnotationWithoutClipping extends LineArrowAnnotation {
    private final Rect clipBounds = new Rect();

    public LineArrowAnnotationWithoutClipping(Context context) {
        super(context);
    }

    @Override
    protected void internalDraw(Canvas canvas, PointF lineStart, PointF lineEnd) {
        try {
            canvas.save();

            // need to extend clip bounds prevent clipping
            // in our case we extend it to cover entire chart
            final ISciChartSurface parentSurface = getParentSurface();
            parentSurface.getBoundsRelativeTo(clipBounds, parentSurface.getAnnotationSurface());

            // apply new clip rect
            canvas.clipRect(clipBounds, Region.Op.REPLACE);

            // draw annotation
            super.internalDraw(canvas, lineStart, lineEnd);
        } finally {
            canvas.restore();
        }
    }
}
Then you just need to initialize annotations with relative coordinates, specify arrow size, stroke and then add them into annotation collection of the chart:
    final LineArrowAnnotationWithoutClipping xAxisArrow = new LineArrowAnnotationWithoutClipping(getActivity());
    final LineArrowAnnotationWithoutClipping yAxisArrow = new LineArrowAnnotationWithoutClipping(getActivity());

    final float length = TypedValue.applyDimension(TypedValue.COMPLEX_UNIT_DIP, 4, getActivity().getResources().getDisplayMetrics());
    final float width = TypedValue.applyDimension(TypedValue.COMPLEX_UNIT_DIP, 8, getActivity().getResources().getDisplayMetrics());

    xAxisArrow.setCoordinateMode(AnnotationCoordinateMode.Relative);
    xAxisArrow.setHeadWidth(width); xAxisArrow.setHeadLength(length);
    xAxisArrow.setX1(0d); xAxisArrow.setX2(1d);
    xAxisArrow.setY1(1d); xAxisArrow.setY2(1d);

    yAxisArrow.setCoordinateMode(AnnotationCoordinateMode.Relative);
    yAxisArrow.setHeadWidth(width); yAxisArrow.setHeadLength(length);
    yAxisArrow.setX1(0d); yAxisArrow.setX2(0d);
    yAxisArrow.setY1(1d); yAxisArrow.setY2(0d);

   Collections.addAll(surface.getAnnotations(), xAxisArrow, yAxisArrow);
Is this suitable for your needs?
Best regards,
Yura
- Yura Khariton answered 7 years ago
 Thank you very much for quick reply, this is excellent. Many thanks again.
- You must login to post comments
Please login first to submit.


