Hello All,
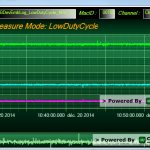
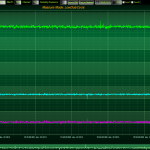
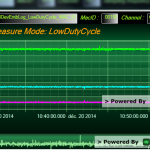
i have a problem with my toolbar : when i minimize my frame the chart will be minimize but the Scrollbar no(like the picture )!! please someone have a idea !! thanks
Best Regards, sahar
<UserControl.Resources>

</UserControl.Resources>

<Grid x:Name="LayoutRoot" ContextMenuClosing="LayoutRoot_ContextMenuClosing">
    <Grid.Resources>
        <Common:DoubleToGridLengthConverter x:Key="DoubleToGridLengthConverter"/>
    </Grid.Resources>


    <Grid.RowDefinitions>
        <RowDefinition Height="Auto"/>
        <RowDefinition Height="*"/>
        <RowDefinition Height="Auto"/>
    </Grid.RowDefinitions>
    <SciChart:SciStockChart x:Name="sciChartSurface" Grid.Row="1" Padding="20,40,10,10"  IsRubberBandZoomEnabled="{Binding IsZoomEnabled}" SciChart:ThemeManager.Theme="Oscilloscope"  >


        <!-- Create three RenderableSeries, which map 1:1 to the DataSeries created in code-behind -->
        <SciChart:SciChartSurface.RenderableSeries>
            <SciChart:FastLineRenderableSeries x:Name="lineSerie" SeriesColor="#FF00FF" StrokeThickness="2" />
            <SciChart:FastLineRenderableSeries x:Name="lineSerie_1" SeriesColor="#00FFFF" StrokeThickness="2" />
            <SciChart:FastLineRenderableSeries x:Name="lineSerie_2" SeriesColor="#00FF00" StrokeThickness="2" />
            <SciChart:FastLineRenderableSeries x:Name="lineSerie_3" SeriesColor="#FFA500" StrokeThickness="2" />
            <SciChart:FastLineRenderableSeries x:Name="lineSerie_4" SeriesColor="#FFA500" StrokeThickness="2" />
            <SciChart:FastLineRenderableSeries x:Name="lineSerie_5" SeriesColor="#FFD700" StrokeThickness="2" />
            <SciChart:FastLineRenderableSeries x:Name="lineSerie_6" SeriesColor="#8A2BE2" StrokeThickness="2" />


        </SciChart:SciChartSurface.RenderableSeries>


        <SciChart:SciStockChart.XAxisStyle>
            <Style TargetType="SciChart:CategoryDateTimeAxis">
                <Setter Property="VisibleRange" Value="{Binding XVisibleRange, Mode=TwoWay}"/>
            </Style>
        </SciChart:SciStockChart.XAxisStyle>
        <SciChart:SciStockChart.XAxis>
            <SciChart:DateTimeAxis  Name="XAxis" AutoRange="Always" DrawMinorTicks="true" DrawMinorGridLines="True"   DrawLabels ="true" DrawMajorGridLines="true" MinHeight="50"  TextFormatting="HH:mm:ss.fff tt MMM dd"
                                  SubDayTextFormatting="HH:mm:ss.fff tt MMM dd yyyy">

                <SciChart:DateTimeAxis.GrowBy>
                    <SciChart:DoubleRange Min="0" Max="0"/>
                </SciChart:DateTimeAxis.GrowBy>

            </SciChart:DateTimeAxis  >
        </SciChart:SciStockChart.XAxis>

        <!-- Create a Y Axis -->
        <SciChart:SciStockChart.YAxis>
            <SciChart:NumericAxis Name="YAxis" AutoRange="Always" AllowDrop="False" ToolTip="true"
                                  DrawMinorTicks="True" DrawMinorGridLines="true" DrawLabels ="true" DrawMajorBands="True" AutoTicks="True" DrawMajorGridLines="true" TextFormatting="0.0000" >

                <SciChart:NumericAxis.GrowBy>
                    <SciChart:DoubleRange Min="0.1" Max="0.1"/>
                </SciChart:NumericAxis.GrowBy>


            </SciChart:NumericAxis>
        </SciChart:SciStockChart.YAxis>

        <!--  Add some modifiers to zoom, zoom extents  -->

        <!--    -->
        <SciChart:SciStockChart.ChartModifier>

            <SciChart:ModifierGroup>


                <SciChart:RubberBandXyZoomModifier x:Name="rubberBandZoomModifier" IsEnabled="True" IsXAxisOnly="False" ZoomExtentsY="False"/>

                <SciChart:ZoomExtentsModifier ExecuteOn="MouseDoubleClick"/>


                <SciChart:CursorModifier ReceiveHandledEvents="True" ShowAxisLabels="True" ShowTooltip="True" ShowTooltipOn="MouseRightButtonDown"  ToolTip="true"/>
                <!-- <SciChart:RubberBandXyZoomModifier IsEnabled="{Binding ChartModifier, Mode=TwoWay, ConverterParameter=RubberBandZoom}" IsXAxisOnly="False"/>-->
                <SciChart:MouseWheelZoomModifier/>
                <!-- For the point values -->


            </SciChart:ModifierGroup>
        </SciChart:SciStockChart.ChartModifier>
    </SciChart:SciStockChart>

    <!-- Define the Toolbar -->
    <!-- Define the Toolbar verticale -->
    <!-- Update Theme -->
    <!--  This grid is used to space Overview Control so its width matches parent chart XAxis  -->

    <Grid Grid.Row="2">
        <!--  The grid is used to set paddings around the Overview, so that the size of the Overview matches the size of the XAxis on the parent chart  -->
        <Grid.ColumnDefinitions>
            <ColumnDefinition Width="20"/>
            <!--  Matches parent surface padding left  -->
            <ColumnDefinition Width="25*"/>
            <!--  Hosts overview control  -->
            <ColumnDefinition Width="0"/>
            <!--  Used to bind to parent surface YAxis  -->
            <ColumnDefinition Width="80"/>
            <!--  Matches parent surface padding right  -->
        </Grid.ColumnDefinitions>

        <helpers:ActualSizePropertyProxy x:Name="proxy" Element="{Binding ElementName=sciChartSurface, Path=YAxis}"/>
        <SciChart:SciChartOverview  Grid.Column="1" ParentSurface="{Binding ElementName=sciChartSurface,
                                                    Mode=OneWay}"
                                                            SciChart:ThemeManager.Theme="{Binding ElementName=cboTheme,
                                                           Path=SelectedItem}"
                            SelectedRange="{Binding XVisibleRange,
                                             Mode=TwoWay}" Focusable="True" />


    </Grid>


    <Grid Grid.Row="1"  VerticalAlignment="top" HorizontalAlignment="Center" >
        <Grid.RowDefinitions>
            <RowDefinition Height="Auto" />
            <RowDefinition Height="Auto" />
        </Grid.RowDefinitions>
        <Grid.Resources>
            <!-- Style for Stats -->
            <Style TargetType="TextBlock" x:Key="StatsStyle">
                <Setter Property="FontSize" Value="26"/>
                <Setter Property="Margin" Value="0"/>
                <Setter Property="FontWeight" Value="Normal"/>
                <Setter Property="FontFamily" Value="pack://application:,,,/Resources/Fonts/#Neuropol Regular"/>
            </Style>
        </Grid.Resources>
        <Grid.ColumnDefinitions>
            <ColumnDefinition Width="Auto"/>
            <ColumnDefinition Width="150"/>
            <ColumnDefinition Width="Auto"/>
            <ColumnDefinition Width="Auto"/>
            <ColumnDefinition Width="200*" />
        </Grid.ColumnDefinitions>
        <Label x:Name="graphPaneTitle" Margin="2" Foreground="#FFFFA500" FontStyle="Italic" FontSize="20" FontStretch="UltraCondensed" Height="31" />
<!—–>
    </Grid>
    <StackPanel Grid.Row="0" Orientation="Horizontal" >
        <!-- <Label x:Name="measureLabel1"    Margin="2"  Foreground="GreenYellow" FontStyle="Normal" FontSize="11" FontStretch="UltraCondensed" Height="25" Target="{Binding}" IsEnabled="True"/> -->
        <ComboBox x:Name="cboTheme" Margin="2,3,2,0" SelectionChanged="cboThemeChanged" Foreground="GreenYellow" HorizontalAlignment="center" SelectedItem="Oscilloscope"  Height="28" Width="92">
            <ComboBox.Background>

                <LinearGradientBrush EndPoint="0.5,1" StartPoint="0.5,0">
                    <GradientStop Color="Black" Offset="0" />
                    <GradientStop Color="#FF979D99" Offset="1" />
                </LinearGradientBrush>

            </ComboBox.Background>
        </ComboBox>
        <Line Margin="2,3,2,0" Stroke="Gray" Y2="25"/>
        <Button Click="PrintToXpsClick" Foreground="GreenYellow"  Margin="2,3,2,0"  Content="Print"  Height="28" >

            <Button.Background>
                <LinearGradientBrush EndPoint="0.5,1" StartPoint="0.5,0">
                    <GradientStop Color="Black" Offset="0" />
                    <GradientStop Color="#FFB3CBBB" Offset="1" />
                </LinearGradientBrush>
            </Button.Background>
        </Button>

      <Button Click="Open_File_function" Foreground="GreenYellow"  Margin="2,3,2,0"  Content="Open File" Height="28" >
            <Button.Background>
                <LinearGradientBrush EndPoint="0.5,1" StartPoint="0.5,0">
                    <GradientStop Color="Black" Offset="0" />
                    <GradientStop Color="#FF979D99" Offset="1" />
                </LinearGradientBrush>
            </Button.Background>
        </Button>

        <TextBox Height="25" HorizontalAlignment="Left" Foreground="GreenYellow" Margin="2,5,0,0" Name="FileNameTextBox"
             VerticalAlignment="Top" Width="200" IsReadOnly="True">
            <TextBox.Background>
                <LinearGradientBrush EndPoint="1,0.5" StartPoint="0,0.5">
                    <GradientStop Color="Black" Offset="0" />
                    <GradientStop Color="#FFD8D8D8" Offset="1" />
                </LinearGradientBrush>
            </TextBox.Background>
        </TextBox>
        <Label x:Name="name_idd" Margin="2" Content="Mac_ID :"
               Foreground="GreenYellow" FontStyle="Italic"  FontSize="13" FontStretch="UltraCondensed" Height="25" />

        <TextBox Height="25" HorizontalAlignment="Left" Foreground="GreenYellow" Margin="2,5,0,0" Name="name_device"
             VerticalAlignment="Top" Width="40" IsReadOnly="True" >
        <TextBox.Background>
            <LinearGradientBrush EndPoint="1,0.5" StartPoint="0,0.5">
                <GradientStop Color="Black" Offset="0" />
                <GradientStop Color="#FFD8D8D8" Offset="1" />
            </LinearGradientBrush>
        </TextBox.Background>
        </TextBox>

        <Label x:Name="channel" Margin="2" Content="Channel :"
               Foreground="GreenYellow" FontStyle="Italic"  FontSize="13" FontStretch="UltraCondensed" Height="25" />

        <TextBox Height="25" HorizontalAlignment="Left" Foreground="GreenYellow" Margin="2,5,0,0" Name="namechannel"
             VerticalAlignment="Top" Width="40" IsReadOnly="True" >
        <TextBox.Background>
            <LinearGradientBrush EndPoint="1,0.5" StartPoint="0,0.5">
                <GradientStop Color="Black" Offset="0" />
                <GradientStop Color="#FFD8D8D8" Offset="1" />
            </LinearGradientBrush>
        </TextBox.Background>
            </TextBox>
        <Label x:Name="freq" Margin="2" Content="Sampling frequency :"
               Foreground="GreenYellow" FontStyle="Italic"  FontSize="13" FontStretch="UltraCondensed" Height="25" />

        <TextBox Height="25" HorizontalAlignment="Left" Foreground="GreenYellow" Margin="2,5,0,0" Name="valfreq"
             VerticalAlignment="Top" Width="40" IsReadOnly="True" >
        <TextBox.Background>
            <LinearGradientBrush EndPoint="1,0.5" StartPoint="0,0.5">
                <GradientStop Color="Black" Offset="0" />
                <GradientStop Color="#FFD8D8D8" Offset="1" />
            </LinearGradientBrush>
        </TextBox.Background>
        </TextBox>
        <Line Margin="2,3,2,0" Stroke="Gray" Y2="25"/>
        <Button Click="SaveAsPngClick" Foreground="GreenYellow"  Margin="2,3,2,0"  Content="Save to PNG" Height="28" >
            <Button.Background>
                <LinearGradientBrush EndPoint="0.5,1" StartPoint="0.5,0">
                    <GradientStop Color="Black" Offset="0" />
                    <GradientStop Color="#FF979D99" Offset="1" />
                </LinearGradientBrush>
            </Button.Background>
        </Button>
        <Button Click="CopyToClipboardClick" Foreground="GreenYellow"  Margin="2,3,2,0"  Content="Copy to Clipboard" Height="28">
            <Button.Background>
                <LinearGradientBrush EndPoint="0.5,1" StartPoint="0.5,0">
                    <GradientStop Color="Black" Offset="0" />
                    <GradientStop Color="#FF979D99" Offset="1" />
                </LinearGradientBrush>
            </Button.Background>
        </Button>
        <Line Margin="2,3,2,0" Stroke="Gray" Y2="25"/>

        <ToggleButton Click="ZoomExtendsClick" Margin="2,3,2,0"  Foreground="GreenYellow" Height="28" >
            <StackPanel Orientation="Horizontal">
                <Image Margin="3" Source="/Abt.Controls.SciChart.Example;component/Resources/Images/fit_to_size.png" Stretch="None"/>
                <TextBlock Margin="3" Text="Extends Zoom"/>

            </StackPanel>

            <ToggleButton.Background>
                <LinearGradientBrush EndPoint="0.5,1" StartPoint="0.5,0">
                    <GradientStop Color="Black" Offset="0" />
                    <GradientStop Color="#FF979D99" Offset="1" />
                </LinearGradientBrush>
            </ToggleButton.Background>
        </ToggleButton>
        <ToggleButton Click="ZoomClick" Margin="2,3,2,0"  Foreground="GreenYellow" Height="28" >
            <StackPanel Orientation="Horizontal">
                <Image Margin="3" Source="/Abt.Controls.SciChart.Example;component/Resources/Images/zoom.png" Stretch="None"/>
                <TextBlock Margin="3" Text="Zoom"/>

            </StackPanel>
            <ToggleButton.Background>
                <LinearGradientBrush EndPoint="1,0.5" StartPoint="0,0.5">
                    <GradientStop Color="Black" Offset="0" />
                    <GradientStop Color="#FF979D99" Offset="1" />
                </LinearGradientBrush>
            </ToggleButton.Background>
        </ToggleButton>
        <CheckBox  Margin="2,3,2,0" Checked="ZoomExtentsY_Checked" Content="ZoomY" Foreground="GreenYellow" Unchecked="ZoomExtentsY_Checked" Height="14" >

        </CheckBox>
        <CheckBox  Margin="2,3,2,0" Checked="ZoomExtentsX_Checked" Foreground="GreenYellow" Content="ZoomX" Unchecked="ZoomExtentsX_Checked" Height="14">
        </CheckBox>
        <Line Margin="2,3,0,0" Stroke="Gray" Y2="25"/>
        <StackPanel.Background>
            <LinearGradientBrush EndPoint="1,0.5" StartPoint="0,0.5">
                <GradientStop Color="Black" Offset="0" />
                <GradientStop Color="Black" Offset="1" />
            </LinearGradientBrush>
        </StackPanel.Background>


    </StackPanel>


</Grid>
- sahar Les asked 9 years ago
- You must login to post comments
Hello Andrew,
Like the picture number one the frame is normal (maximized) and the picture number two the frame is minimize ! my problem is with the toolbar i want when i minimize the frame the toolbar minimize automatically like the chart, thanks
Best regards, sahar
- sahar Les answered 9 years ago
 Hi Sahar, It's not a SciChart question as your toolbar is not part of SciChart. Sounds like you need to ask on a WPF forum such as www.stackoverflow.com? Best regards, Andrew
 Hi Andrew, Thanks a lot, Best Regards, Sahar
- You must login to post comments
Please login first to submit.


