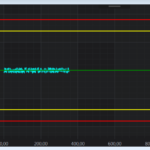
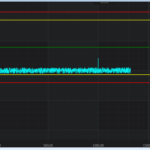
Hi!
I have the following xaml code for HorizontalLineAnnotations. I have a viewmodel with simple properties for WasteMaxValue etc.
I don’t get any binding errors. Sometimes everything works as expected when I start up. Sometimes the lines show up but they wont follow when I resize the view (and the graph). Sometimes the lines don’t show up at all.
If I do a very fast “pan” with the mouse so that the graph data moves outside the graph, the lines show up and they follow when I resize the view and the graph. Have you experienced this before? Is it an obvious error?
            <s:SciChartSurface.Annotations>
                <s:HorizontalLineAnnotation HorizontalAlignment="Stretch"
                    Y1="{Binding WasteMaxValue}" Stroke="Red" StrokeThickness="2">
                </s:HorizontalLineAnnotation>
                <s:HorizontalLineAnnotation HorizontalAlignment="Stretch"
                    Y1="{Binding WasteMinValue}" Stroke="Red" StrokeThickness="2">
                </s:HorizontalLineAnnotation>
                <s:HorizontalLineAnnotation HorizontalAlignment="Stretch"
                    Y1="{Binding WarningMaxValue}" Stroke="Yellow" StrokeThickness="2">
                </s:HorizontalLineAnnotation>
                <s:HorizontalLineAnnotation HorizontalAlignment="Stretch"
                    Y1="{Binding WarningMinValue}" Stroke="Yellow" StrokeThickness="2">
                </s:HorizontalLineAnnotation>
                <s:HorizontalLineAnnotation HorizontalAlignment="Stretch"
                    Y1="{Binding SetValue}" Stroke="Green" StrokeThickness="2">
                </s:HorizontalLineAnnotation>
        </s:SciChartSurface.Annotations>
- Jonas Larsson asked 8 years ago
 Hi Jonas, this is not a known problem so we’d ask for a little more info or code to help us reproduce before investigating. Can you do that? Best regards, Andrew
 Hi Andrew! Thanks for a fast reply. I found the problem/bug. See my answer below.
- You must login to post comments
Hi again!
I’ve struggled with this for some days (while working with other stuff).
Now I found the “bug”.
I have added a PointMarker to the graph. I have the intention to use it for changing the size of the PointMarker dynamically so that they are larger when zoomed in.
That binding isn’t working yet. This made the graph doing a lot of strange things. When i commented out those lines, everything worked fine (see the lines below).
Another strange thing I saw on one version of my sw, with the lines below, was the following. The annotations worked as they should while the graph data was outside the graph view.
                    <s:FastLineRenderableSeries.PointMarker>
                    <s:EllipsePointMarker Width="{Binding PointSize}" Height="{Binding PointSize}"
                          Fill="SteelBlue" Stroke="LightSteelBlue" StrokeThickness="1"/>
                </s:FastLineRenderableSeries.PointMarker>
I guess that this issue is solved. But you may want to prevent this in the future!?
- Jonas Larsson answered 8 years ago
 Hi Jonas, no idea why this code above causes the problem but I can guess that an exception internal to scichart, or a bad binding can cause rendering (of scichart, or of WPF) to stop entirely hence the intermittent behaviour you’re seeing. Does the same problem occur if you vary the size of the point marker programmatically?
 Hi Andrew! I’ve not tried to do it programmatically yet. Maybe it will work with a correct binding. I guessed the same thing as you regarding the bad binding. This feature with the point marker size is actually not supposed to be implemented right now (I’m not allowed to :-) ). We will investigate this when we start working on this for real. I will comment when we are working on this. Ok?
 Sure no probs! I think width/height should work but the problem might come if the width/height are updated when the marker is drawing. If programmatically setting it works then you have a binding issue of some kind (possibly caused by SciChart EllipsePointMarker DataContext, or another issue). If doesn’t work then my suggestion is to create a custom point marker.
- You must login to post comments
Please login first to submit.


