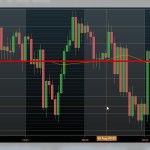
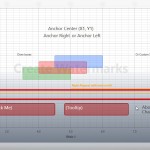
Hi I need that my stock chart to be very flexibilely configured. For example the SciStockChart already has a price of the current candle on the right. Can I add a line to it ? Like “Line Annotation”? does that mean I have to disable the original price marker, and add a Line annotation manually binded to latest price? Which is the best option to have a real time stock chart? To use a SciStockChart and customize it or use SciChartSurface and implement all needed functionality? On the images I showed what I need. Thanks in advance!
- dmitri bodiu asked 9 years ago
- last edited 9 years ago
- You must login to post comments
SciStockChart inherits SciCharSurface, and adds some default (less flexible) configuration, so you don’t have to write so much code.
Our advice is
-
If you need ultimate flexibility, use SciChartSurface
-
If you are happy with the limited configuration, but easy coding of SciStockChart, then use that
See also SciStockChart with DateTimeAxis for some background info on the differences between SciChartSurface and SciStockChart.
Best regards,
Andrew
- Andrew Burnett-Thompson answered 9 years ago
- You must login to post comments
Please login first to submit.


