I am using a GradientColorPalette to apply a color mapping to a WaterfallRenderableSeries3D. It appears that the gradient positions determined by GradientColorPalette are dynamically set based on the maximum and minimum value displayed on the chart.
I would like the gradient positions to be determined by a static value, similar to how setting the “Minimum” and “Maximum” properties of a HeatmapColorPalette class works.
Is there a way to do this using GradientColorPalette?
Thanks
- Cole Bagshaw asked 4 days ago
when I try to add multiple 3d charts in XML files it crashes. Not sure it is possible at all to have multiple 3d charts being rendered in a single activity.
- Jesse Ma asked 4 days ago
Hi There,
I have 2 FastColumnRenderableSeries, one of which has 4 points and the 2nd has 2 points in dataseries.
Please see the attached image.
Is there a way to make all the columns have the same width ?
Thanks in advance!
-Harut
- Harutyun Tovmasyan asked 5 days ago
- last active 10 hours ago
Hi,
When I created the FastBandRenderableSeries type, I encountered an aliasing problem. When I used AntiAliasing, it still didn’t work.
There is an example of used code:
List<double> xData = GetData("D:\\x.txt");

List<double> yData = GetData("D:\\y.txt");

List<double> y1Data = GetData("D:\\y1.txt");

XyyDataSeries<double, double> splineBanDataSeries = new XyyDataSeries<double, double>();

splineBanDataSeries.Append(xData, yData, y1Data);

var bandSeries = new FastBandRenderableSeries()

{

DataSeries = splineBanDataSeries,

//Name = id,

StrokeThickness = 1,

Fill = Colors.Transparent,

FillY1 = Colors.Transparent,

StrokeY1 = Colors.LightGray,

AntiAliasing = true,

StrokeDashArrayY1 = new double[] { 5, 1 }

};

sciChart.RenderableSeries.Add(bandSeries);

sciChart.ZoomExtents();
Is there any way to correct this error?
Thank you.
- li xiaohang asked 6 days ago
- last active 4 days ago
Hi,
I’ve got some questions to expand on this topic: https://www.scichart.com/questions/js/how-do-you-export-or-save-a-chart-as-an-image-in-js-library
1) Can you export areas of a chart that are not visible on the screen? I have a large line chart, like a seismograph, that is never fully displayed on the screen because it is too long.
2) Can you export from a chart that is not visible on the screen?
Thank you
- max keirn asked 7 days ago
- last active 5 days ago
The first question: Where did the example go (link below)?
https://support.scichart.com/support/solutions/articles/101000513349-tutorial-custom-legend-with-color-picker-and-custom-point-markers
I want to do like what and time ago I saved link but now this page is deleted. I need it because it is good example for resolve my 2nd question I think.
And the second question: I have chart
    <s:SciChartSurface Grid.Row="0" Grid.Column="0" x:Name="SciChartSurface" Margin="5" Padding="5"
                       ChartTitle="{mainVM:Localization MainChartSciChartSurface}" RenderableSeries="{s:SeriesBinding RenderableSeries}" Annotations="{s:AnnotationsBinding Annotations}">
        <s:SciChartSurface.XAxis>
            <s:NumericAxis AxisTitle="{mainVM:Localization XNumericAxis}" VisibleRange="{Binding VisibleRangeXAxis, Mode=TwoWay}" />
        </s:SciChartSurface.XAxis>
        <s:SciChartSurface.YAxis>
            <s:NumericAxis GrowBy="0.1,0.1"
                           AxisTitle="{mainVM:Localization YNumericAxis}" VisibleRange="{Binding VisibleRangeYAxis, Mode=TwoWay}" AutoRange="{Binding IsStaticYAxis, Converter={StaticResource StaticAxisToSciChartAutoRangeConverter}}" />
        </s:SciChartSurface.YAxis>
        <s:SciChartSurface.ChartModifier>
            <s:ModifierGroup>
                <s:SeriesValueModifier />
                <s:CursorModifier IsEnabled="{Binding IsShowValuesCursor}" />
                <s:LegendModifier x:Name="SciChartLegendModifier" GetLegendDataFor="AllSeries" ShowLegend="False"
                                  SeriesData="{Binding SeriesData, Mode=TwoWay}" />
            </s:ModifierGroup>
        </s:SciChartSurface.ChartModifier>
    </s:SciChartSurface>
Legend of chart placed in another panel
    <s:SciChartLegend x:Name="SciChartLegendControl" s:ThemeManager.Theme="Chrome" Margin="5,5" ScrollViewer.HorizontalScrollBarVisibility="Auto" ScrollViewer.VerticalScrollBarVisibility="Auto"
                      LegendData="{Binding SeriesData, Mode=OneWay}" ShowVisibilityCheckboxes="True" />
SeriesData is
private ChartDataObject _seriesData;
public ChartDataObject SeriesData
{
    get => _seriesData;
    set => SetProperty(ref _seriesData, value, nameof(SeriesData));
}
I want to see chart values in additional fields near the chart. I made this
<Grid>
    <Grid.ColumnDefinitions>
        <ColumnDefinition Width="Auto" />
    </Grid.ColumnDefinitions>
    <ListView Grid.Column="0" x:Name="ChartsListView" BorderBrush="Transparent" ItemContainerStyle="{StaticResource ListViewItemContainerDefaultStyle}"
              ItemsSource="{Binding SeriesData.SeriesInfo}">
        <ListView.ItemTemplate>
            <DataTemplate>
                <Grid>
                    <Grid.ColumnDefinitions>
                        <ColumnDefinition Width="*" />
                        <ColumnDefinition Width="Auto" />
                    </Grid.ColumnDefinitions>
                    <Label Grid.Column="0" Style="{StaticResource LabelDefaultStyle}"
                           Content="{Binding SeriesName}" Visibility="{Binding IsVisible, Converter={StaticResource BooleanToVisibilityConverter}}" />
                    <Label Grid.Column="1" Style="{StaticResource LabelIndicatorStyle}"
                           Content="{Binding YValue}" />
                </Grid>
            </DataTemplate>
        </ListView.ItemTemplate>
    </ListView>
</Grid>
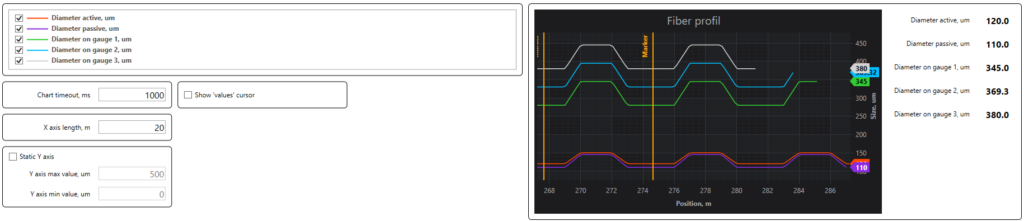
All working correctly. But I want to bind Legend visibility checkboxes to my custom controls for values: when I uncheck chart checkbox control bound to this chart must becomes invisible. In code above I write
Visibility="{Binding IsVisible, Converter={StaticResource BooleanToVisibilityConverter}}"
but it not worked. How can I make it like I want?
And 3rd question: how can I guarantee the order of SeriesData lines? I have to be sure that charts in legend and custom controls ordered in the same ordering
- Fedor Iudin asked 1 week ago
- last active 11 hours ago
Hello,
I have issues when I want to apply a custom CustomPolygonRenderableSeries.
For implementation it was used sci-chart documentation from
enter link description here
enter link description here
It takes a while to show just 10000 polygons from 40000 points! When I tried to slide or zoom main window it got some freezes for 1-1.5 seconds. The main problem is in redrawing several times(protected override void Draw). There is an example of used code:
public class CustomPolygonRenderableSeries : CustomRenderableSeries
{
    protected override void Draw(IRenderContext2D renderContext, IRenderPassData renderPassData)
    {
        var dataPointSeries = renderPassData.PointSeries as XyzPointSeries;

        if (dataPointSeries == null) return;
        if (dataPointSeries.XValues.All(double.IsNaN)) return;

        var xCalc = renderPassData.XCoordinateCalculator;
        var yCalc = renderPassData.YCoordinateCalculator;

        // try to filter some polygons by visible range
        var xVisibleRange = XAxis.VisibleRange;
        var yVisibleRange = YAxis.VisibleRange;

        var points = new Point[4];
        var step = 4;
        for (var index = 0; index < dataPointSeries.Count; index += step)
        {
            if (!xVisibleRange.IsValueWithinRange(dataPointSeries.XValues[index + 3]) ||
                !yVisibleRange.IsValueWithinRange(dataPointSeries.YValues[index + 3])) continue;

            for (int i = 0; i < step; ++i)
            {
                points[i].X = xCalc.GetCoordinate(dataPointSeries.XValues[index + i]);
                points[i].Y = yCalc.GetCoordinate(dataPointSeries.YValues[index + i]);
            }

            var intColor = (int)dataPointSeries.ZPoints[index];
            var color = System.Drawing.Color.FromArgb(intColor).ToMediaColor();

            var brush = new SolidColorBrush(color);
            using var sBrush = renderContext.CreateBrush(brush, Opacity);
            renderContext.FillPolygon(sBrush, points);
        }
    }
}

public class CustomPolygonRenderableSeriesViewModel : BaseRenderableSeriesViewModel
{
    public override Type ViewType => typeof(CustomPolygonRenderableSeries);
}
Is this a known performance issue? Is there some way to by-pass it?
Thank you.
Sincerely, Roman
- Raman Sharkovich asked 2 weeks ago
- last active 1 week ago
Hello SciChart Community,
I am currently working on a Windows Forms C# application where I need to visualize a 2D byte array (A[MxN]) on a 3D chart using SciChart. However, I’m facing some difficulties in achieving this task.
My goal is to display the contents of the byte array A on a 3D surface plot or another suitable 3D chart type provided by SciChart. Each byte value in the array represents some intensity or elevation value.
I have explored the documentation and examples provided by SciChart, but I couldn’t find specific guidance on how to achieve this.
Could you please provide some assistance or guidance on how I can achieve this visualization using SciChart in a Windows Forms C# application? Any code snippets, examples, or documentation references would be greatly appreciated.
Thank you in advance for your help.
Best regards,
Namblue73.
- Mr Nha asked 2 weeks ago
- last active 2 weeks ago
I wanted to customized my box annotation further, for example, I wanted to give my box annotation some border radius, it seem like there is no way to do so currently.
I know that there is custom annotation like svg annotation, but those are svg, the reason Custom annotation doesn’t work for me is because they are not responsive to zooming since they are image/svg, unlike normal box annotation.
For example, for normal box annotation, I can give it x1 to x2 so that when I zoom in the chart, the box annotation expanded. But for Custom annotation, they only take one x point for placement, so I can not cover x1 to x2, it only going to stay on x1.
So, I wonder if there is currently a way I can add border radius to a box annotation, or is there a plan to do so in the future?
Let me know, thank you!
- Nung Khual asked 2 weeks ago
- last active 2 weeks ago
Hi,
I know that when I use MouseWheelZoomModifier with my chart surface, the default behavior is:
1. On mouse wheel (No keyboard mod) – Zoom according to the “ActionType” propery, and direction according to the “XYDirection” property.
2. On mouse wheel + CTRL – X-Axis pan
3. On mouse wheel + Shift – Y-Axis pan
I want to achieve this behavior:
1. On mouse wheel (No keyboard mod) – Zoom according to the “ActionType” propery, and direction according to the “XYDirection” property.
2. On mouse wheel + CTRL – XY-Axis Zoom
3. On mouse wheel + Shift – Y-Axis Zoom
Any idea how to achieve this behavior?
Thanks, Ben.
- Ben Mendel asked 2 weeks ago
- last active 1 week ago
If there is a ChartModifier on the SciChart Surface, the Focus moves to the chart just by moving the mouse up without clicking the mouse.
The v6.2.0.13254 version does not have this problem, but the v8.0.0.27737 version does.
You can see that the focus is moving just by moving the mouse through the video.
How can i solve it?
- JONGBOG JOUNG asked 3 weeks ago
- last active 2 weeks ago
We managed to create a functioning chart, but sometimes when we first ran the chart it produced this error, followed by the chart being completely unable to display.
We attached the error message produced in DevTools, the expected outcome and the actual outcome when the error occurred.
- Suzanne Ong asked 3 weeks ago
- last active 3 weeks ago
 <s:SciChartSurface x:Name="U_DataChart"
                    Grid.Row="0"
                    Margin="20"
                    s:ThemeManager.Theme="BrightSpark"
                    Background="{StaticResource BackColorBrush}"
                    BorderBrush="{Binding BorderColor}"
                    BorderThickness="{Binding BorderThinkness}"
                    MouseDoubleClick="U_DataChart_MouseDoubleClick"
                    MouseLeftButtonDown="U_DataChart_MouseLeftButtonDown"
                    Style="{StaticResource SciChartSurfaceStyle}">

     <s:SciChartSurface.XAxes>
         <s:NumericAxis x:Name="xAxis"
                        Margin="0,10,0,0"
                        Padding="0,0,0,0"
                        AxisTitle="{Binding XAxisTitle}"
                        DrawMajorBands="False"
                        DrawMajorGridLines="False"
                        DrawMajorTicks="False"
                        Id="WaveRange"
                        Style="{StaticResource AxisStyle}"
                        VisibleRangeLimitMode="MinMax">
             <s:NumericAxis.TickLabelStyle>
                 <Style TargetType="s:DefaultTickLabel">
                     <Setter Property="Foreground" Value="{StaticResource FontColorGrayBrush}" />
                     <Setter Property="FontSize" Value="25" />
                 </Style>
             </s:NumericAxis.TickLabelStyle>

             <s:NumericAxis.TitleStyle>
                 <Style TargetType="s:AxisTitle">
                     <Setter Property="Foreground" Value="{StaticResource FontColorGrayBrush}" />
                     <Setter Property="FontSize" Value="25" />
                 </Style>
             </s:NumericAxis.TitleStyle>
         </s:NumericAxis>
     </s:SciChartSurface.XAxes>

     <s:SciChartSurface.YAxes>
         <s:NumericAxis x:Name="yAxis"
                        Margin="0,0,0,0"
                        Padding="0,0,0,0"
                        AxisAlignment="Left"
                        AxisTitle="{Binding YAxisTitle}"
                        DrawMajorBands="False"
                        DrawMajorTicks="False"
                        Id="ValueRange"
                        Style="{StaticResource AxisStyle}"
                        VisibleRangeLimitMode="MinMax">
             <s:NumericAxis.TickLabelStyle>
                 <Style TargetType="s:DefaultTickLabel">
                     <Setter Property="Foreground" Value="{StaticResource FontColorGrayBrush}" />
                     <Setter Property="FontSize" Value="25" />
                 </Style>
             </s:NumericAxis.TickLabelStyle>
             <s:NumericAxis.TitleStyle>
                 <Style TargetType="s:AxisTitle">
                     <Setter Property="Foreground" Value="{StaticResource FontColorGrayBrush}" />
                     <Setter Property="FontSize" Value="25" />
                 </Style>
             </s:NumericAxis.TitleStyle>
         </s:NumericAxis>
     </s:SciChartSurface.YAxes>

     <s:SciChartSurface.ChartModifier>
         <s:ModifierGroup x:Name="U_ChartModifier" />
     </s:SciChartSurface.ChartModifier>
 </s:SciChartSurface>

 <!--<s:SciChartOverview Grid.Row="1"
                     Height="100"
                     Margin="20,0,20,10"
                     Padding="0,0,0,0"
                     s:ThemeManager.Theme="BrightSpark"
                     Background="{StaticResource BackColorBrush}"
                     BorderBrush="{Binding BorderColor}"
                     BorderThickness="1"
                     DataSeries="{Binding ElementName=m_view, Path=U_DataChart.RenderableSeries}"
                     ParentSurface="{Binding Source={x:Reference Name=U_DataChart}}"
                     SelectedRange="{Binding Source={x:Reference Name=U_DataChart}, Path=XAxis.VisibleRange, Mode=TwoWay}"
                     Visibility="{Binding OverViewVisibility}" />-->

 <!--  DataSeries="{Binding Source={x:Reference Name=U_DataChart}, Path=RenderableSeries}"  -->
 <s:SciChartSurface x:Name="OverviewSurface"
                    Grid.Row="1"
                    Height="100"
                    Margin="20,0,20,10"
                    Padding="0,0,0,0"
                    s:ThemeManager.Theme="BrightSpark"
                    Background="{StaticResource BackColorBrush}"
                    BorderBrush="{Binding BorderColor}"
                    BorderThickness="1"
                    Style="{StaticResource SciChartSurfaceStyle}"
                    Visibility="{Binding OverViewVisibility}">

     <!--<s:SciChartSurface.RenderableSeries>
         <s:FastLineRenderableSeries DataSeries="{Binding Path=Series}" />
     </s:SciChartSurface.RenderableSeries>-->

     <s:SciChartSurface.XAxis>
         <s:NumericAxis DrawMajorGridLines="False"
                        DrawMinorGridLines="False"
                        Style="{StaticResource AxisStyle}"
                        Visibility="Collapsed" />
     </s:SciChartSurface.XAxis>

     <s:SciChartSurface.YAxis>
         <s:NumericAxis DrawMajorGridLines="False"
                        DrawMinorGridLines="False"
                        Style="{StaticResource AxisStyle}"
                        Visibility="Collapsed" />
     </s:SciChartSurface.YAxis>
 </s:SciChartSurface>


 <s:SciChartScrollbar Grid.Row="1"
                      Height="100"
                      Margin="20,0,20,10"
                      Axis="{Binding Source={x:Reference Name=xAxis}}"
                      Background="Transparent"
                      BorderThickness="{Binding BorderThinkness}"
                      Visibility="{Binding OverViewVisibility}" />
Viewmodel.cs
public ObservableCollection<IRenderableSeries> Series
{
    get
    {
        return m_view.U_DataChart.RenderableSeries;
    }
    set
    {
        m_view.U_DataChart.RenderableSeries = value;
        OnPropertyChanged(nameof(Series));
    }
}

private void UpdateChartEvent(Point p_well, ObservableCollection<MeasureDataSt> p_data, PlateSetting p_ps)
{
    if (p_data.Count == 0)
    {
        this.SCIChartControlVM.ClearChart();
        return;
    }

    this.SCIChartControlVM.ClearChart();
    {
        ObservableCollection<(double, double)> tempData = new ObservableCollection<(double, double)>();
        foreach (MeasureDataSt sample in p_data)
            tempData.Add((sample.Wave, sample.Intensity));

        var Color = Application.Current.FindResource("ChartInitSeriesBrush") as Brush;
        var Series = SCIChartSeries.SetChartDataForScatterLine(tempData, this.SCIChartControlVM.GetXAxis, this.SCIChartControlVM.GetYAxis,
            ref this.SCIChartControlVM.FixedColorIndex, Color);
        this.SCIChartControlVM.Series.Add(Series);

        if (this.SCIChartControlVM.Series.LastOrDefault().DataSeries is XyDataSeries<double, double> data)
        {
            var AnnoColor = Application.Current.FindResource("ChartHZLineAnnotation") as Brush;
            this.SCIChartControlVM.AddHorizontalLineAnnotation(data.YValues.Max(), Brushes.White, AnnoColor, false, true);
        }
    }
    this.SCIChartControlVM.CalibrationChart();
}
I am manually adding series to the m_view.U_DataChart.RenderableSeries collection. I would like to directly bind m_view.U_DataChart.RenderableSeries to SciChartSurface (x:Name=”OverviewSurface”). I understand that using IRenderableSeriesViewModel for binding from the beginning would have been the correct approach, but it’s too late for major modifications at this point. Therefore, I have no choice but to pursue this method.
Is there a way to accomplish this?
- jeong younghoon asked 4 weeks ago
- last active 3 weeks ago
Hi!
I have next error crash in my desktop app:
Application: DRYERRPP.NET.exe
CoreCLR Version: 8.0.123.58001
.NET Version: 8.0.1
Description: The process was terminated due to an unhandled exception.
Exception Info: System.AccessViolationException: Attempted to read or write protected memory. This is often an indication that other memory is corrupt.
Stack:
at ukt.aafs(System.Runtime.InteropServices.HandleRef)
at ukt.aafs(System.Runtime.InteropServices.HandleRef)
at SciChart.Charting2D.Interop.TSRWPFTarget.ResolveFinalImage()
at nki.ysm()
at naj.nmo(nkf, SciChart.Charting2D.Interop.SCRTRenderContext)
at nkk.Dispose()
at SciChart.Charting.Visuals.SciChartSurface.DoDrawingLoop()
at SciChart.Charting.Visuals.SciChartSurface.ses(System.Object, SciChart.Drawing.Common.DrawEventArgs)
at SciChart.Drawing.Common.RenderSurfaceBase.OnDraw()
at SciChart.Drawing.Common.RenderSurfaceBase.OnRenderTimeElapsed()
at SciChart.Drawing.Common.RenderTimer.nqv()
at System.Windows.Media.MediaContext.RenderMessageHandlerCore(System.Object)
at System.Windows.Media.MediaContext.RenderMessageHandler(System.Object)
at System.Windows.Threading.ExceptionWrapper.InternalRealCall(System.Delegate, System.Object, Int32)
at System.Windows.Threading.ExceptionWrapper.TryCatchWhen(System.Object, System.Delegate, System.Object, Int32, System.Delegate)
at System.Windows.Threading.DispatcherOperation.InvokeImpl()
at MS.Internal.CulturePreservingExecutionContext.CallbackWrapper(System.Object)
at System.Threading.ExecutionContext.RunInternal(System.Threading.ExecutionContext, System.Threading.ContextCallback, System.Object)
at MS.Internal.CulturePreservingExecutionContext.Run(MS.Internal.CulturePreservingExecutionContext, System.Threading.ContextCallback, System.Object)
at System.Windows.Threading.DispatcherOperation.Invoke()
at System.Windows.Threading.Dispatcher.ProcessQueue()
at System.Windows.Threading.Dispatcher.WndProcHook(IntPtr, Int32, IntPtr, IntPtr, Boolean ByRef)
at MS.Win32.HwndWrapper.WndProc(IntPtr, Int32, IntPtr, IntPtr, Boolean ByRef)
at System.Windows.Threading.ExceptionWrapper.InternalRealCall(System.Delegate, System.Object, Int32)
at System.Windows.Threading.ExceptionWrapper.TryCatchWhen(System.Object, System.Delegate, System.Object, Int32, System.Delegate)
at System.Windows.Threading.Dispatcher.LegacyInvokeImpl(System.Windows.Threading.DispatcherPriority, System.TimeSpan, System.Delegate, System.Object, Int32)
at MS.Win32.HwndSubclass.SubclassWndProc(IntPtr, Int32, IntPtr, IntPtr)
at MS.Win32.UnsafeNativeMethods.DispatchMessage(System.Windows.Interop.MSG ByRef)
at MS.Win32.UnsafeNativeMethods.DispatchMessage(System.Windows.Interop.MSG ByRef)
at System.Windows.Threading.Dispatcher.PushFrameImpl(System.Windows.Threading.DispatcherFrame)
at System.Windows.Application.RunDispatcher(System.Object)
at System.Windows.Application.RunInternal(System.Windows.Window)
at DRYERRPP.NET.App.Main()
Can somebody help me?
- Gera Daniloff asked 4 weeks ago
When using AutoRange.Once on an axis, I expect the auto ranging to be done exactly once.
If at some point, I change the visible range to match the default one (0 to 10 for numeric axis), the auto range is triggered again.
Happens more if I provide inputs so the user can define a range, and depending on the use case, 0 to 10 is not that uncommon.
Kind of an edge case, but still something that can happen, and is definitely unexpected.
This can be seen happening here https://codepen.io/jrfv/full/xxeqwOd
- João Velasques asked 4 weeks ago
- last active 2 weeks ago
Hi there,
Here is my xaml setting :
 <s:SciStockChart.XAxisStyle>
     <Style TargetType="s:CategoryDateTimeAxis">
         <Setter Property="VisibleRange" Value="{Binding ParentViewModel.XRange}" />
         <Setter Property="AutoRange" Value="{Binding ParentViewModel.AutoRangeX}"/>
     </Style>
 </s:SciStockChart.XAxisStyle>
And I also set, XRange = new IndexRange(0, 9), AutoRangeX = AutoRange.Never, but the chart show like image, always has gap there.
What should I do?
- CHIA CHUN TANG asked 4 weeks ago
- last active 4 weeks ago
We’re allowing our users to place down annotations on the chart with an annotation creation modifier. One of these annotations is a Text annotation.
We then allow users to save these annotations into our own proprietary file format and load them back in with the chart data. To do this we iterate through the AnnotationCollection of the chart and parse the SciChart annotations to data we save to our files.
To save the content of the text for the TextAnnotation we read the TextAnnotation.Text property. However, we’ve noticed that this property is not set until the annotation has lost focus (we click away from the annotation somewhere else on the chart). If we save the annotation before we click away from it, we do not get the current text from the TextAnnotation.Text property.
The process to reproduce this is:
1. Place down a TextAnnotation.
2. Edit the TextAnnotation content. Do not click away from the text so to annotation remains in “Editing” mode
3. Save the data.
4. As we’re saving we read the TextAnnotation.Text property to save to our file. However, the TextAnnotation.Text property returns a blank string because its still being edited.
Is there a way from within our code that we can finish the editing of the text annotation, so that when we get the TextAnnotation.Text property it is the current text the user typed in? Or is there a way to get the current text within the TextAnnotation without finishing the editing or changing the focus?
- Jamie Agate asked 4 weeks ago
- last active 3 weeks ago
Hi,
I want to get the currently selected series like isCheckedChangedCallback in js. But there is no similar method in the documentation, how should I implement this function.
- yu dexiu asked 1 month ago
- last active 4 weeks ago
Hi,
we recently updated SciChart to 8.3.0.28019 and now we got an issue with double y axis title.
They should only be on the left side. Any ideas what could have caused this? I have also attached the definition of the axis, hopefully this helps.
 vm.YAxes.Add(new NumericAxisViewModel
 {
     Id = YNumericAxis,
     StyleKey = YAxisStyleKey,
     AxisTitle = vm.YAxisTitle,
     FontSize = groupViewOptions.AxisLabelFontSize,
     TitleFontSize = groupViewOptions.AxisTitleFontSize,
     DrawMinorGridLines = false,
     DrawLabels = true,
     CursorTextFormatting = "0.###",
     TextFormatting = "0.########"
 });
vm.YAxes.Add(new LogarithmicNumericAxisViewModel()
{
    Id = YLogAxis,
    StyleKey = YAxisStyleKey,
    AxisTitle = vm.YAxisTitle,
    FontSize = groupViewOptions.AxisLabelFontSize,
    TitleFontSize = groupViewOptions.AxisTitleFontSize,
    DrawMinorGridLines = false,
    DrawLabels = true,
    TextFormatting = "0.0###E0",
    CursorTextFormatting = "0.000E0",
    EnableHighPrecisionTicks = groupViewOptions.EnableHighPrecisionTicks
});
Yes, there are two axis’s defined and if I try to change the visibility of the one that is active, both axis title’s disappear. What do you think could be the cause of this? I did some research thru the structure and didn’t have any luck.
Thanks in advance.
Boštjan
- Boštjan Arzenšek asked 1 month ago
- last active 4 weeks ago
I am considering applying server-side licensing for my javerScript application.
In the document below, there is a phrase “Our server-side licensing component is written in C++.”
(https://support.scichart.com/index.php?/Knowledgebase/Article/View/17256/42/)
However, there is only asp.net sample code on the provided github.
(https://github.com/ABTSoftware/SciChart.JS.Examples/tree/master/Sandbox/demo-dotnet-server-licensing)
I wonder if there is a sample code implemented in C++ for server-side licensing.
Can you provide c++ sample code?
Also, are there any examples to run on Ubuntu?
- Gopika V asked 1 month ago
- last active 4 weeks ago
There seems to be no documentation on how to configure scichart when using app router with nextJS, and I am running into an error.
I have followed a combination of this tutorial, and additional setup for nextJS found here, specifically the next.config.js file, copy-files-from-to.json, and additions to package.json. But I continue to get the error: ‘Module has already been declared’. (first/second pics in PDF)
I have attached a photos inside the pdf, including my project structure, and a zip with the files to duplicate.
Steps to replicate:
1) extract files and add root package.json to a directory of your choice
2) from within this directory, use ‘yarn create next-app scichart-prototype’ (use set-up options from 4th image in PDF)
3) Replace root layout.tsx and page.tsx with files in zip, add SciChartDemo directory and add page.tsx from that (also in zip)
4) replace the next.config.mjs file with the next.config.mjs file from the zip
5) add the copy-files-from-to.json from the zip
6) replace the package.json file in scichart-prototype directory with file from the zip.
7) run ‘yarn install’ to add packages
8) run ‘turbo dev’
9) after visiting localhost:3000/ click the Sci Chart Demo link to see error.
Thanks for taking a look.
- max keirn asked 2 months ago
- last active 1 month ago
I am considering applying server-side licensing for my javerScript application.
In the document below, there is a phrase “Our server-side licensing component is written in C++.”
(https://support.scichart.com/index.php?/Knowledgebase/Article/View/17256/42/)
However, there is only asp.net sample code on the provided github.
(https://github.com/ABTSoftware/SciChart.JS.Examples/tree/master/Sandbox/demo-dotnet-server-licensing)
I wonder if there is a sample code implemented in C++ for server-side licensing.
Can you provide c++ sample code?
Also, are there any examples to run on Ubuntu?
- Simone Russo asked 2 months ago
- last active 1 month ago
I am considering applying server-side licensing for my javerScript application.
In the document below, there is a phrase “Our server-side licensing component is written in C++.”
(https://support.scichart.com/index.php?/Knowledgebase/Article/View/17256/42/)
However, there is only asp.net sample code on the provided github.
(https://github.com/ABTSoftware/SciChart.JS.Examples/tree/master/Sandbox/demo-dotnet-server-licensing)
I wonder if there is a sample code implemented in C++ for server-side licensing.
Can you provide c++ sample code?
Also, are there any examples to run on Ubuntu?
- Ben Green asked 2 months ago
- last active 1 month ago
Hi,
I am currently facing an issue related to our implementation.
We want the graph to zoom in whenever the user drags the y-axis upward, and conversely, zoom out when the user drags the y-axis downward. Importantly, this behavior should remain consistent regardless of whether the user drags the graph from the positive or negative side.
- Ziv Tziyonit asked 2 months ago
- last active 1 month ago
I am considering applying server-side licensing for my javerScript application.
In the document below, there is a phrase “Our server-side licensing component is written in C++.”
(https://support.scichart.com/index.php?/Knowledgebase/Article/View/17256/42/)
However, there is only asp.net sample code on the provided github.
(https://github.com/ABTSoftware/SciChart.JS.Examples/tree/master/Sandbox/demo-dotnet-server-licensing)
I wonder if there is a sample code implemented in C++ for server-side licensing.
Can you provide c++ sample code?
Also, are there any examples to run on Ubuntu?
- Mohamed Ben Amar asked 2 months ago
- last active 2 weeks ago
I applied alpha color to FastLineRenderableSeries, but it was not visible. On the other hand, FastColumnRenderableSeries works well with alpha color. Please check the issue.
Example Code
class AlphaChart {
    private val colorAlpha00 = ColorUtil.argb(0x00, 0xFF, 0xCC, 0x80) // 0%
    private val colorAlpha1A = ColorUtil.argb(0x1A, 0xFF, 0xCC, 0x80) // 10%
    private val colorAlpha33 = ColorUtil.argb(0x33, 0xFF, 0xCC, 0x80) // 20%
    private val colorAlpha4D = ColorUtil.argb(0x4D, 0xFF, 0xCC, 0x80) // 30%
    private val colorAlpha66 = ColorUtil.argb(0x66, 0xFF, 0xCC, 0x80) // 40%
    private val colorAlpha80 = ColorUtil.argb(0x80, 0xFF, 0xCC, 0x80) // 50%
    private val colorAlpha99 = ColorUtil.argb(0x99, 0xFF, 0xCC, 0x80) // 60%
    private val colorAlphaB3 = ColorUtil.argb(0xB3, 0xFF, 0xCC, 0x80) // 70%
    private val colorAlphaCC = ColorUtil.argb(0xCC, 0xFF, 0xCC, 0x80) // 80%
    private val colorAlphaE6 = ColorUtil.argb(0xE6, 0xFF, 0xCC, 0x80) // 90%
    private val colorAlphaFF = ColorUtil.argb(0xFF, 0xFF, 0xCC, 0x80) // 100%

    fun initAlphaChart(surface: SciChartSurface) {
        surface.suspendUpdates {
            theme = R.style.SciChart_Alpha

            xAxes {
                numericAxis {
                    autoRange = AutoRange.Always
                    growBy = DoubleRange(0.1, 0.1)
                }
            }
            yAxes {
                numericAxis {
                    autoRange = AutoRange.Always
                    growBy = DoubleRange(0.2, 0.2)
                }
            }
            renderableSeries {
                fastColumnRenderableSeries {
                    dataSeries = createDataSeries(2.0)
                    paletteProvider = AlphaPaletteProvider()
                }
                fastLineRenderableSeries {
                    dataSeries = createDataSeries(3.0)
                    strokeStyle = SolidPenStyle(colorAlpha00, 2f) // 0% - Not Visible
                }
                fastLineRenderableSeries {
                    dataSeries = createDataSeries(3.1)
                    strokeStyle = SolidPenStyle(colorAlpha1A, 2f) // 10% - Not Visible
                }
                fastLineRenderableSeries {
                    dataSeries = createDataSeries(3.2)
                    strokeStyle = SolidPenStyle(colorAlpha33, 2f) // 20% - Not Visible
                }
                fastLineRenderableSeries {
                    dataSeries = createDataSeries(3.3)
                    strokeStyle = SolidPenStyle(colorAlpha4D, 2f) // 30% - Not Visible
                }
                fastLineRenderableSeries {
                    dataSeries = createDataSeries(3.4)
                    strokeStyle = SolidPenStyle(colorAlpha66, 2f) // 40% - Not Visible
                }
                fastLineRenderableSeries {
                    dataSeries = createDataSeries(3.5)
                    strokeStyle = SolidPenStyle(colorAlpha80, 2f) // 50% - Not Visible
                }
                fastLineRenderableSeries {
                    dataSeries = createDataSeries(3.6)
                    strokeStyle = SolidPenStyle(colorAlpha99, 2f) // 60% - Not Visible
                }
                fastLineRenderableSeries {
                    dataSeries = createDataSeries(3.7)
                    strokeStyle = SolidPenStyle(colorAlphaB3, 2f) // 70%
                }
                fastLineRenderableSeries {
                    dataSeries = createDataSeries(3.8)
                    strokeStyle = SolidPenStyle(colorAlphaCC, 2f) // 80%
                }
                fastLineRenderableSeries {
                    dataSeries = createDataSeries(3.9)
                    strokeStyle = SolidPenStyle(colorAlphaE6, 2f) // 90%
                }
                fastLineRenderableSeries {
                    dataSeries = createDataSeries(4.0)
                    strokeStyle = SolidPenStyle(colorAlphaFF, 2f) // 100%
                }
            }
            chartModifiers {
                rolloverModifier {}
            }
        }
    }

    private fun createDataSeries(yValues: Double): XyDataSeries<Int, Double> {
        return XyDataSeries<Int, Double>().apply {
            for (index in 1..10) {
                append(index, yValues)
            }
        }
    }
}


class AlphaPaletteProvider :
    PaletteProviderBase<FastColumnRenderableSeries>(FastColumnRenderableSeries::class.java),
    IFillPaletteProvider, IStrokePaletteProvider {
    private val colorAlpha00 = ColorUtil.argb(0x00, 0xFF, 0xCC, 0x80) // 0%
    private val colorAlpha1A = ColorUtil.argb(0x1A, 0xFF, 0xCC, 0x80) // 10%
    private val colorAlpha33 = ColorUtil.argb(0x33, 0xFF, 0xCC, 0x80) // 20%
    private val colorAlpha4D = ColorUtil.argb(0x4D, 0xFF, 0xCC, 0x80) // 30%
    private val colorAlpha66 = ColorUtil.argb(0x66, 0xFF, 0xCC, 0x80) // 40%
    private val colorAlpha80 = ColorUtil.argb(0x80, 0xFF, 0xCC, 0x80) // 50%
    private val colorAlpha99 = ColorUtil.argb(0x99, 0xFF, 0xCC, 0x80) // 60%
    private val colorAlphaB3 = ColorUtil.argb(0xB3, 0xFF, 0xCC, 0x80) // 70%
    private val colorAlphaCC = ColorUtil.argb(0xCC, 0xFF, 0xCC, 0x80) // 80%
    private val colorAlphaE6 = ColorUtil.argb(0xE6, 0xFF, 0xCC, 0x80) // 90%
    private val colorAlphaFF = ColorUtil.argb(0xFF, 0xFF, 0xCC, 0x80) // 100%

    private val colors = IntegerValues(
        intArrayOf(
            colorAlpha00,
            colorAlpha1A,
            colorAlpha33,
            colorAlpha4D,
            colorAlpha66,
            colorAlpha80,
            colorAlpha99,
            colorAlphaB3,
            colorAlphaCC,
            colorAlphaE6,
            colorAlphaFF
        )
    )

    override fun update() {}

    override fun getFillColors(): IntegerValues = colors

    override fun getStrokeColors(): IntegerValues = colors
}
- Jeong HaMin asked 2 months ago
- last active 2 months ago
I am trying to subscribe to Visible Range changes on a DateTimeNumericAxis, it is not working, am I doing something wrong?
- Jhonatan Laguna asked 2 months ago
- last active 2 months ago
Hi, im facing a problem related to VisibleRange Auto,
when a value is much higher than the values
already plotted and I try to scroll along the X axis,
the value on the Y axis does not fully show the candle.
Please see the attached images.
As you can see, the biggest value of my last candle is 41.75, however,
the numberRange that is being used in VisibleRange Auto is 41.63.
Is there any way around this?
- rocket trade asked 2 months ago
In the example code below, we attach two RenderableSeries to a single SciChartSurface.
The first RenderableSeries adds data from surface.suspendUpdates, and the second RenderableSeries adds data from setVisibleRangeChangeListener, which causes the chart to freeze.
The chart freezes even when I take actions such as using suspendUpdates in setVisibleRangeChangeListener, or adding data after performing a check such as Axis.isAttached.
However, if I run the code related to the dataSeries in the main thread, as shown in the code, the freezing goes away. Is this the correct way to perform changes to the dataSeries in the setVisibleRangeChangeListener?
import android.view.View
import com.scichart.charting.Direction2D
import com.scichart.charting.modifiers.AxisDragModifierBase
import com.scichart.charting.visuals.SciChartSurface
import com.scichart.charting.visuals.axes.AutoRange
import com.scichart.charting.visuals.axes.AxisAlignment
import com.scichart.charting.visuals.renderableSeries.FastCandlestickRenderableSeries
import com.scichart.core.model.DateValues
import com.scichart.core.model.DoubleValues
import com.scichart.data.model.DoubleRange
import com.scichart.examples.utils.scichartExtensions.OhlcDataSeries
import com.scichart.examples.utils.scichartExtensions.XyDataSeries
import com.scichart.examples.utils.scichartExtensions.categoryDateAxis
import com.scichart.examples.utils.scichartExtensions.chartModifiers
import com.scichart.examples.utils.scichartExtensions.fastColumnRenderableSeries
import com.scichart.examples.utils.scichartExtensions.numericAxis
import com.scichart.examples.utils.scichartExtensions.pinchZoomModifier
import com.scichart.examples.utils.scichartExtensions.renderableSeries
import com.scichart.examples.utils.scichartExtensions.rolloverModifier
import com.scichart.examples.utils.scichartExtensions.suspendUpdates
import com.scichart.examples.utils.scichartExtensions.xAxes
import com.scichart.examples.utils.scichartExtensions.xAxisDragModifier
import com.scichart.examples.utils.scichartExtensions.yAxes
import com.scichart.examples.utils.scichartExtensions.zoomPanModifier
import java.util.Date

fun initSampleCode(surface: SciChartSurface, ) {
surface.suspendUpdates {
    val ohlcDataSeries = OhlcDataSeries<Date, Double>()
    val ohlcRenderableSeries = FastCandlestickRenderableSeries().apply {
        dataSeries = ohlcDataSeries
    }
    val volumeDataSeries = XyDataSeries<Double, Double>("volume series")

    val sharedYRange = DoubleRange(0.0, 10.0)
    val volumeProfileXRange = DoubleRange(0.0, 10.0)

    renderableSeries {
        fastColumnRenderableSeries {
            dataSeries = volumeDataSeries
            xAxisId = "column-xAxis"
            yAxisId = "column-yAxis"

            dataPointWidth = 1.0
        }
        add(ohlcRenderableSeries)
    }

    xAxes {
        // 캔들
        categoryDateAxis {
//                axisId = "date-xAxis"
            cursorTextFormatting = "yyyy.MM"
            textFormatting = "yyyy.MM"

            setVisibleRangeChangeListener { axis, oldRange, newRange, isAnimate ->
                val columnYDoubleValues = DoubleValues()
                columnYDoubleValues.add(1.0)
                columnYDoubleValues.add(2.0)
                columnYDoubleValues.add(3.0)
                columnYDoubleValues.add(4.0)
                columnYDoubleValues.add(5.0)
                columnYDoubleValues.add(6.0)
                columnYDoubleValues.add(7.0)
                columnYDoubleValues.add(8.0)
                columnYDoubleValues.add(9.0)
                columnYDoubleValues.add(10.0)

                val columnXDoubleValues = DoubleValues()
                columnXDoubleValues.add(725_000.0)
                columnXDoubleValues.add(736_000.0)
                columnXDoubleValues.add(747_000.0)
                columnXDoubleValues.add(758_000.0)
                columnXDoubleValues.add(769_000.0)
                columnXDoubleValues.add(770_000.0)
                columnXDoubleValues.add(781_000.0)
                columnXDoubleValues.add(792_000.0)
                columnXDoubleValues.add(803_000.0)

                // !!CHART FREEZED!!
                volumeDataSeries.clear()
                volumeDataSeries.append(columnXDoubleValues, columnYDoubleValues)

                // NOT FREEZED
//                    CoroutineScope(Dispatchers.Main).launch {
//                        volumeDataSeries.clear()
//                        volumeDataSeries.append(columnXDoubleValues, columnYDoubleValues)
//                    }
            }
        }
        numericAxis {
            axisId = "column-xAxis"
            autoRange = AutoRange.Never
            axisAlignment = AxisAlignment.Right
            visibility = View.GONE

            this.flipCoordinates = true

            visibleRange = sharedYRange
        }
    }
    yAxes {
        numericAxis {
            // axisId = "price-yAxis"
            autoRange = AutoRange.Always
            growBy = DoubleRange(0.2, 0.2)
            cursorTextFormatting = "###,###"
            textFormatting = "###,###"

            visibleRange = sharedYRange
        }
        numericAxis {
            axisId = "column-yAxis"
            axisAlignment = AxisAlignment.Bottom
            // visibility = View.GONE

            visibleRange = volumeProfileXRange
        }
    }

    chartModifiers {
        xAxisDragModifier {
            receiveHandledEvents = true
            dragMode = AxisDragModifierBase.AxisDragMode.Pan
        }
        pinchZoomModifier {
            receiveHandledEvents = true
            direction = Direction2D.XDirection
        }
        zoomPanModifier {
            receiveHandledEvents = true
        }
        rolloverModifier()
    }

    val sampleDateValues = DateValues()
    sampleDateValues.add(
        arrayOf(
            Date(1388070000000),
            Date(1388156400000),
            Date(1388242800000),
            Date(1388329200000),
            Date(1388415600000),
            Date(1388502000000),
            Date(1388588400000),
            Date(1388674800000),
            Date(1388761200000),
        )
    )
    val sampleOpenValues = DoubleValues()
    sampleOpenValues.add(
        doubleArrayOf(
            737000.0,
            750000.0,
            750000.0,
            740000.0,
            768000.0,
            768000.0,
            776000.0,
            778000.0,
            831000.0,
        )
    )
    val sampleHighValues = DoubleValues()
    sampleHighValues.add(
        doubleArrayOf(
            755000.0,
            750000.0,
            750000.0,
            772000.0,
            800000.0,
            795000.0,
            788000.0,
            840000.0,
            846000.0
        )
    )
    val sampleLowValues = DoubleValues()
    sampleLowValues.add(
        doubleArrayOf(
            737000.0,
            750000.0,
            728000.0,
            740000.0,
            763000.0,
            765000.0,
            773000.0,
            774000.0,
            819000.0,
        )
    )
    val sampleCloseValues = DoubleValues()
    sampleCloseValues.add(
        doubleArrayOf(
            755000.0,
            750000.0,
            739000.0,
            768000.0,
            768000.0,
            777000.0,
            778000.0,
            834000.0,
            846000.0
        )
    )

    ohlcDataSeries.clear()
    ohlcDataSeries.append(sampleDateValues, sampleOpenValues, sampleHighValues, sampleLowValues, sampleCloseValues)
}
}
- JAIHOON PARK asked 2 months ago
- last active 2 months ago
Please answer about it (https://www.scichart.com/questions/ios/is-it-possible-to-make-customannotation-like-axis-marker-annotation)
- Junyoung Kang asked 2 months ago
Hello,
I’m attempting to build one of the WPF examples on a machine that has no internet access. I get the error mentioned in the title. When I exported the project, I selected the “Installation Folder” option rather than the “NuGet Package”.
How can I fix this error?
Thanks, Brett S.
- Brett Stahlman asked 2 months ago
- last active 2 months ago
I am considering applying server-side licensing for my javerScript application.
In the document below, there is a phrase “Our server-side licensing component is written in C++.”
(https://support.scichart.com/index.php?/Knowledgebase/Article/View/17256/42/)
However, there is only asp.net sample code on the provided github.
(https://github.com/ABTSoftware/SciChart.JS.Examples/tree/master/Sandbox/demo-dotnet-server-licensing)
I wonder if there is a sample code implemented in C++ for server-side licensing.
Can you provide c++ sample code?
Also, are there any examples to run on Ubuntu?
- JAIHOON PARK asked 2 months ago
- last active 4 weeks ago
Hi,
I would like to use the UniformXyDataSeries because I have different Y values that are equidistant in time. I then assumed that I could use UniformXyDataSeries when X values are equidistant. I created an object of type UniformXyDataSeries but this class expects the XStart and XStep to be double values. I would like to provide TimeSpan values instead of double values. Is there any class that lets us have this setup (uniform data series with Y being double values and X equidistant TimeSpan values)?
Now, if I create a UniformXyDataSeries and provide XStep to be 0.0001 (double value) seconds and set the X axis being a TimeSpanAxis, the chart will not be rendered because it is saying it cannot convert the double value of XStep into a TimeSpan.
Thank you!
Alex
- Alexandru Neamtu asked 2 months ago
- last active 2 months ago
Hi,
I feel this should be obvious but I cannot find the answer in the docs. I have multiple Y axis and I want all of them to start at 0 and autoRange only the max value. Also, the zooming should not be affected, it should have normal behavior. I just want the axis to go from 0 to auto max value when we call ZoomExtents(). The default behavior of the ZoomExtents() is auto min value to auto max value.
Is there any way we can achieve this with SciChart?
Thank you,
Alex
- Alexandru Neamtu asked 2 months ago
- last active 2 months ago
I have a design where I want to show something like a box at the top of the chart and when hovering on it, it should show up a tooltip with some info, the issue I’m running into is the fact that I can’t seem to find way I can add tooltip to box annotation other than adding another box annotation when hover or hit, but it seem that it is not recommended base on my previous post before.
I also looked into scatterXY series or pointMarker, the issue with Point marker or scatter series is that I can only set one x and y, but my design require the box to be from a certain x1 point to x2 point. I can probably try to calculate the width and set the width to the point marker, but I would rather not if there is a better way.
Also looked into column chart, but that also have the same issue of only one x and y point and not sure about tooltip, but definitely seem more promising than annotation.
Please let me know if there is a better way to accomplish this, thank you!
The image below is the design.
- Nung Khual asked 2 months ago
- last active 2 months ago
I intend to use the Ctrl key to allow the user to select multiple FastLineRenderableSeries at once in an onkeydown event. Is there any way to do so while maintaining the default behavior?
Note: I was able to use onSelectedChanged to select a FastLineRenderableSeries, but I was only able to select one FastLineRenderableSeries at a time.
Here’s the code that I have to generate the FastLineRenderableSeries:
let fastLineRenderableSeries = new FastLineRenderableSeries(this.wasmContextGraph, {
      dataSeries: xyDataSeries,
      id: traceId,
      xAxisId: this.sciChartGraph.xAxes.get(0).id.toString(),
      yAxisId: traceData.array[0][0],
      isVisible: true,
      isSelected: false,
      opacity: 1,
      resamplingMode: EResamplingMode.Auto,

      onSelectedChanged: (sourceSeries, isSelected) => {
        if (isSelected){
          // some unrelated functions
        } else {
          // some unrelated functions
        }
      }
  });
- Suzanne Ong asked 2 months ago
- last active 2 months ago
I am having UX issues with overlapping Bars on BarChart with certain datasets. Example attached is the code
https://codesandbox.io/p/sandbox/javascript-column-chart-forked-p59p75?file=%2Fsrc%2FApp.tsx%3A49%2C1
please uncomment lines at 47 and 48 for a different set of x and y values where it works fine.
Not sure what am i doing wrong.
- vamsi pallem asked 2 months ago
- last active 2 months ago
I have a React application showing a real time updated chart which works well when receives data from event-based WebSocket. Now I need to modify the app with a new data source. I have an aysnc function to get a batch of data in an interval.
kinesisReadInterval.current = setInterval(async () => {
        const recordsResponse = await kinesisRef.current.getRecords({ ShardIterator: shardIterator }).promise();
        recordsResponse.Records.forEach(record => {
            try {
                const dataObj = JSON.parse(record.Data.toString('utf-8'));
                spectrumAnalyzerRef.current.metaDataHandler(dataObj);
            } catch (jsonError) {
                spectrumAnalyzerRef.current.binaryDataHandler(record.Data.buffer);
            }
        });

        shardIterator = recordsResponse.NextShardIterator;

        if (!shardIterator || !kinesisConected.current) {
                clearInterval(intervalId); // Stop interval if conditions are not met
        }
    }, 1000);
The recordsResponse.Records contains a batch of records and I want to update the chart based on these records one by one. From my logs, I can see that the binaryDataHandler() which will call appendRange() ran successfully for each record. However, the chart only redraws for the last record of the recordsResponse.Records. I have tried to store the recordsResponse.Records in a state variable and loop to update the chart later, but still got the same result. I am not sure whether it’s chart related issue or React rendering issue. Do you have any idea?
- Quyen Sy asked 2 months ago
- last active 2 months ago
I have a 3D surface chart.
I programmatically add some custom entities derived from BaseSceneEntity, invoked by a user action on some other part of my UI.
When I add the items, to get the screen to refresh I use this loop after adding a number of entities:
        foreach(var item in _zone_items)
        {
            item.InvalidateScene();
        }
_zone_items is a List holding the custom entities which have been added to the chart using
MainSurfaceChart.Viewport3D.RootEntity.Children.Add(cube);
This works fine, and even if I have removed some items from the _zone_items list, the screen still refreshes correctly and shows only the current items in _zone_items (and in RootEntity.Children)
The problem I have is when I remove all items from _zone_items. When I do this I use this loop:
        foreach (var item in _zone_items)
        {
            MainSurfaceChart.Viewport3D.RootEntity.Children.Remove(item);
        }
        _zone_items.Clear();
(I use Remove(item) rather than Clear as in future I may have other entities which are not in _zone_items).
but now I have no way to refresh the screen as I have no entities to call InvalidateScene(). If I touch the mouse on the chart surface and move just slightly it re-renders and the entities are not re-drawn – so they have been removed.
How can I get the chart to refresh/re-render so as to remove the entities which are no longer in the RootEntity.Children? I would have hoped removing them from Children would remove them from the screen?
Thanks
Andrew M
- Andrew Milford asked 2 months ago
- last active 2 months ago
I am considering applying server-side licensing for my javerScript application.
In the document below, there is a phrase “Our server-side licensing component is written in C++.”
(https://support.scichart.com/index.php?/Knowledgebase/Article/View/17256/42/)
However, there is only asp.net sample code on the provided github.
(https://github.com/ABTSoftware/SciChart.JS.Examples/tree/master/Sandbox/demo-dotnet-server-licensing)
I wonder if there is a sample code implemented in C++ for server-side licensing.
Can you provide c++ sample code?
Also, are there any examples to run on Ubuntu?
- Lawson McWhorter asked 2 months ago
- last active 1 week ago
Hello,
I switched from NumericAxis to DateTimeNumericAxis to view x axis labels in hh:mm format. It is definitely showing the labels in this format which is what I wanted, but for some reason it always show “Jan 1” in the first label. I simply want to show hh:mm labels based on the X values. One thing to now is that this is a live updating chart, not static data.
What am I missing? attached is a picture showing the issue and a picture with the DateTimeNumericAxis configuration.
Thanks.
Sergio.
- Sergio Faura asked 2 months ago
- last active 2 months ago
Hi
I recently updated my SciChart license previously was using 6.3.0 but now using 8.3.0. Without changing any code other than the SetRuntimeLicenseKey I noticed a bunch of binding errors.
Warning 4 null Foreground TextBlock.Foreground Brush Cannot find source: RelativeSource FindAncestor, AncestorType=’SciChart.Charting.Visuals.RenderableSeries.LegendPlaceholder’, AncestorLevel=’1′.
Code below:
<SciChart:SciChartLegend
HorizontalAlignment="Left"
VerticalAlignment="Top"
LegendData="{Binding LegendData, ElementName=mainLegend}"
ShowVisibilityCheckboxes="True">
<SciChart:SciChartLegend.ItemsPanel>
    <ItemsPanelTemplate>
        <WrapPanel ItemWidth="150" Orientation="Horizontal" />
    </ItemsPanelTemplate>
</SciChart:SciChartLegend.ItemsPanel>
Searching for same problem I noticed someone else had exactly the same issue with an earlier version. This was addressed at the time with an update. Wondered if the issue had creeped back in?
- Miles Merckel asked 2 months ago
Hello,
I am experiencing an issue with the BoxAnnotation in SciChart where the precision of the box’s boundaries does not accurately match the data points it is supposed to represent. When dynamically creating a BoxAnnotation to highlight a range of values on a chart, the upper boundary (y2) is set to match the maximum value within the specified range. Despite the calculation seeming accurate, the rendered annotation’s top edge is visually lower than the top of the highest column it encompasses, creating a slight discrepancy. In my application, I am creating a lot of charts, and this issue occurs only on charts with a big data range.
Environment:
SciChart Version: 3.2.532
Browser: Chrome
Attaching code snippet on jsfiddle:
https://jsfiddle.net/c9dekx6v/2/
Regards,
Dmytro
- Dmytro Smirnov asked 2 months ago
- last active 2 months ago
When using FastCandlestickRenderableSeries, I want every value to appear on the chart. I tried to use DataLabelProvider for this, but it didn’t work. What can I do.
class CustomDataLabelProvider extends DataLabelProvider {
onDataPoint(renderableSeries, xValue, yValue) {
    const labelText = `${yValue.toFixed(2)}`;

    const label = document.createElement('div');
    label.textContent = labelText;
    label.style.position = 'absolute';
    label.style.color = 'black';
    label.style.fontSize = '12px';
    label.style.left = `${this.parentSurface.coordinateCalculator.getCoordinateFrom(xValue) - label.clientWidth / 2}px`;
    label.style.top = `${this.parentSurface.coordinateCalculator.getCoordinateFrom(yValue) - label.clientHeight}px`;

    this.parentSurface.annotationCanvas.appendChild(label);
  }
}


const { sciChartSurface, wasmContext } = await SciChartSurface.create("scichart-root", {
theme: new SciChartJSLightTheme(),
titleStyle: { fontSize: 22 },
 });

sciChartSurface.applyTheme(new SciChartJSLightTheme());
sciChartSurface.xAxes.add(new NumericAxis(wasmContext));
sciChartSurface.yAxes.add(new NumericAxis(wasmContext));
const yAxis = sciChartSurface.yAxes.get(0);
yAxis.visibleRange = new NumberRange(LAL, UAL);
const xAxis = sciChartSurface.xAxes.get(0);
xAxis.visibleRange = new NumberRange(0, endBarIndex);

const dataSeries = new OhlcDataSeries(wasmContext, {
xValues: xValues,
openValues: compositeScanAverageArray,
highValues: yValues,
lowValues: compositeScanAverageArray,
closeValues: yValues,
});

sciChartSurface.renderableSeries.add(new FastCandlestickRenderableSeries(wasmContext, {
dataSeries: dataSeries,
strokeThickness: 1,
dataPointWidth: 0.5,
paletteProvider: new CustomPaletteProvider(),
dataLabelProvider: new CustomDataLabelProvider(),
 }));
- Can Ata Tekirdağlı asked 2 months ago
- last active 2 months ago
Hi everyone,
I have a chart with a ZoomPanModifier that allows to pan over the X axis only, what I’d like to accomplish is to append more data when the user reaches the max value of the axis while panning.
Is there an event to bind to a command or some other way to do something like this in MVVM?
I’d like to avoid using visible range events and only have this behaviour while panning if possible.
Thanks a lot,
Marco
- Marco Bilardi asked 2 months ago
- last active 2 months ago
I want to use a different color for each value in the chart I created here. To put it simply, if the value is greater than 10, I want it to appear yellow, if it is less than green, and red if it is less than 0. thanks
const { sciChartSurface, wasmContext } = await SciChartSurface.create("scichart-root", {
    theme: new SciChartJSLightTheme(),
});
sciChartSurface.applyTheme(new SciChartJSLightTheme());
sciChartSurface.xAxes.add(new NumericAxis(wasmContext));
sciChartSurface.yAxes.add(new NumericAxis(wasmContext));
const yAxis = sciChartSurface.yAxes.get(0);
yAxis.visibleRange = new NumberRange(LAL, UAL);
const xAxis = sciChartSurface.xAxes.get(0);
xAxis.visibleRange = new NumberRange(0, endBarIndex);

const dataSeries = new OhlcDataSeries(wasmContext, {
    xValues: xValues,
    openValues: yValues,
    highValues: compositeScanAverageArray,
    lowValues: yValues,
    closeValues: compositeScanAverageArray,
});
const renderableSeries = new FastCandlestickRenderableSeries(wasmContext, {
    dataSeries,
    stroke: "white",
    strokeThickness: 1,
});

sciChartSurface.renderableSeries.add(renderableSeries);
sciChartSurface.annotations.add(
    new SciChart.BoxAnnotation({
        stroke: "yellow",
        strokeThickness: 1,
        fill: "rgba(255, 255, 0, 0.3)",
        x1: 0,
        x2: endBarIndex,
        y1: UAL,
        y2: UWL,
    })
);
sciChartSurface.annotations.add(
    new SciChart.BoxAnnotation({
        stroke: "yellow",
        strokeThickness: 1,
        fill: "rgba(255, 255, 0, 0.3)",
        x1: 0,
        x2: endBarIndex,
        y1: LAL,
        y2: LWL,
    })
);
sciChartSurface.annotations.add(
    new SciChart.BoxAnnotation({
        stroke: "green",
        strokeThickness: 1,
        fill: "rgba(0, 128, 0, 0.3)",
        x1: 0,
        x2: endBarIndex,
        y1: LWL,
        y2: UWL,
    })
);
sciChartSurface.annotations.add(
    new SciChart.LineAnnotation({ stroke: "#FF6600", strokeThickness: 3, x1: startBarIndex, x2: endBarIndex, y1: compositeScanAverage, y2: compositeScanAverage }),
);

sciChartSurface.chartModifiers.add(new MouseWheelZoomModifier());
sciChartSurface.chartModifiers.add(new ZoomPanModifier());
}
- Can Ata Tekirdağlı asked 2 months ago
- last active 2 months ago
I want to make label on yAxis.
SCIChart provides AxisMarkerAnnotation, but I want to use CustomAnnotation because I need something custom.
So I tried drawing a CustomAnnotation on the yAxis but failed.
Android succeeds in drawing CustomAnnotation on the yAxis using the method below, but iOS doesn’t provide it?
On iOS, Can’t customAnnotation only set the value of the yAxis like AxisMarkerAnnotation?
Android was possible…
error message like this
Exception raised with reason: CALayer position contains NaN: [nan 248.71]. Layer: <CALayer:0x280c10bc0; position = CGPoint (0 0); bounds = CGRect (0 0; 0 0); delegate = <BTChart.CurrentPriceAnnotationView: 0x13d74d8f0; frame = (0 0; 0 0); layer = <CALayer: 0x280c10bc0>>; sublayers = (<_UILabelLayer: 0x282d15860>); opaque = YES; allowsGroupOpacity = YES; >
- Junyoung Kang asked 2 months ago
- last active 2 months ago
Hi
I used trial license. and I would like to know if it is possible to implement it as shown in the attached Image.
I want to put multiple items into one series.
And I would like to display the units in milliseconds or Numberics.
- Kang minyoung asked 3 months ago
Hello to everyone. I want to take the starting point of my bar charts as 20, for example, rather than 0. If the data is 3, I want to create a bar chart going from point 20 to 23, and if it is -3, from point 20 to 17, can you help me?
- Can Ata Tekirdağlı asked 3 months ago
