Hello
I have 2 charts, a 2D Heatmap and a 3D Waterfall chart, and I want to be able to programmatically change their color palettes.
The 2D heatmap is set up like this, with the GradientStops bound to an ObservableCollection:
...
<s:HeatmapColorPalette x:Key="HeatmapColorPalette" Maximum="{Binding MaxValue,Mode=TwoWay}"  GradientStops="{Binding ColorPalette}"/>
...
<s:SciChartSurface.RenderableSeries>
    <s:FastUniformHeatmapRenderableSeries
        x:Name="heatmapSeries"
        DataSeries="{Binding Data}"
        ColorMap="{StaticResource HeatmapColorPalette}">
    </s:FastUniformHeatmapRenderableSeries>
 </s:SciChartSurface.RenderableSeries>
...
This works as expected. When the binding changes the palette/heatmap changes.
The 3D waterfall is set up the similarly:
...
<s3D:GradientColorPalette x:Key="GradientColorPalette" IsStepped="False"  GradientStops="{Binding ColorPalette}" />
...
<s3D:SciChart3DSurface.RenderableSeries>
    <s3D:WaterfallRenderableSeries3D
        x:Name="waterfallSeries"
        DataSeries="{Binding Data3D}"
        YColorMapping="{StaticResource GradientColorPalette}"
        SliceThickness="1">
    </s3D:WaterfallRenderableSeries3D>
</s3D:SciChart3DSurface.RenderableSeries>
...
This, when passed the same data, doesn’t render the chart.
This chart otherwise works fine if I define the GradientStops statically in the XAML.
This is the GradientStops definition (in f#):
let BlueRed =
        new ObservableCollection<GradientStop>([
            new GradientStop(Color.FromRgb(0x00uy,0x00uy,0xFFuy),0.0)
            new GradientStop(Color.FromRgb(0xFFuy,0x00uy,0x00uy),1.0)
        ])
I am not sure what I am missing.
(edit: apologies for formatting issues in the question)
- Joseph Roorda asked 5 years ago
- last active 5 years ago
Hello! How i can create same style on select chart
i use public class XyCustomPaletteProvider extends PaletteProviderBase<XyRenderableSeriesBase> implements IFillPaletteProvider, IStrokePaletteProvider, IPointMarkerPaletteProvider { but i can pass only single color like this:
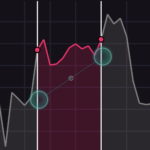
I try create three AreaStyle with gradient but nothing could be done…
use version SciChart 4.4.0.4739
- Sergey Evdokimov asked 11 months ago
- last active 11 months ago
