Hello.
I’d checked examples from your Demo ‘SciChart.Examples.Demo’ and looks like the example “SciChart.Examples.Examples.CreateRealtimeChart.UsingSeriesValueModifier” is applicable for me because I need functionality like this.
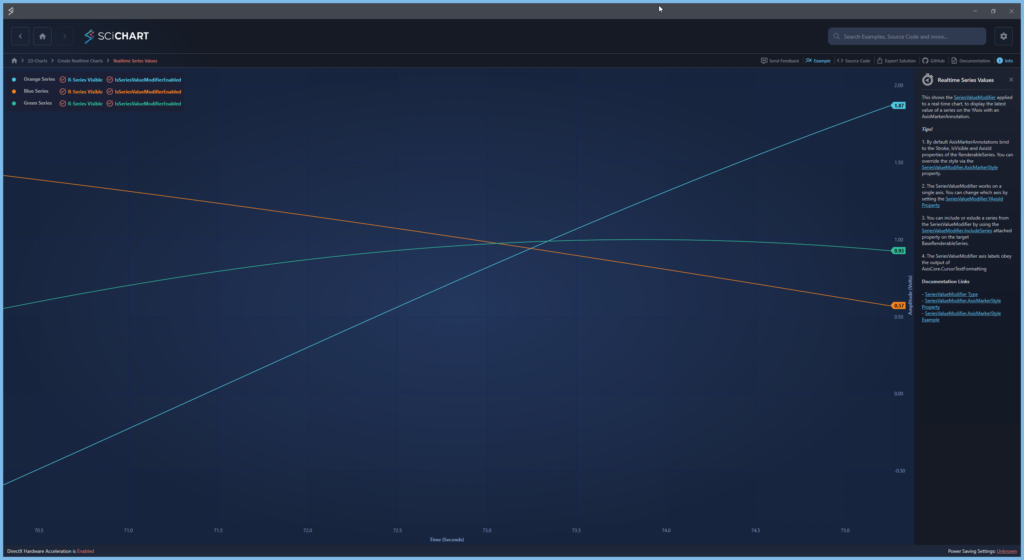
But as I understand Legend as LegendModifier component is a part of chart and it ‘know’ about chart data and can manipulate layout of it. In my application I want to have chart settings not in chart layout but in separate part of application. Can I bind chart settings with my custom controls? At start I want to set visibility for chart series which created in code
        private XyDataSeries<double, double> _lineDataDiameter1;
        private XyDataSeries<double, double> _lineDataDiameter2;
        private XyDataSeries<double, double> _lineDataCovering1;
        private XyDataSeries<double, double> _lineDataCovering2;
        private XyDataSeries<double, double> _lineDataCovering3;

private void InitCharts()
    { // TODO names and color maybe make as settings
        _lineDataDiameter1 = InitChart(new InitChartRequest() { ChartName = CHART_NAME_DIAMETER_1, LineColor = Colors.OrangeRed, ChartStyle = CHART_LINE_STYLE, LineThickness = CHART_LINE_THICKNESS });
        _lineDataDiameter2 = InitChart(new InitChartRequest() { ChartName = CHART_NAME_DIAMETER_2, LineColor = Colors.BlueViolet, ChartStyle = CHART_LINE_STYLE, LineThickness = CHART_LINE_THICKNESS });
        _lineDataCovering1 = InitChart(new InitChartRequest() { ChartName = CHART_NAME_COVERING_1, LineColor = Colors.LimeGreen, ChartStyle = CHART_LINE_STYLE, LineThickness = CHART_LINE_THICKNESS });
        _lineDataCovering2 = InitChart(new InitChartRequest() { ChartName = CHART_NAME_COVERING_2, LineColor = Colors.DeepSkyBlue, ChartStyle = CHART_LINE_STYLE, LineThickness = CHART_LINE_THICKNESS });
        _lineDataCovering3 = InitChart(new InitChartRequest() { ChartName = CHART_NAME_COVERING_3, LineColor = Colors.White, ChartStyle = CHART_LINE_STYLE, LineThickness = CHART_LINE_THICKNESS });
    }

    private XyDataSeries<double, double> InitChart(InitChartRequest request)
    {
        XyDataSeries<double, double> lineData = new()
        {
            SeriesName = request.ChartName,
        };

        RenderableSeries.Add(new LineRenderableSeriesViewModel()
        {
            StrokeThickness = request.LineThickness,
            Stroke = request.LineColor,
            DataSeries = lineData,
            StyleKey = request.ChartStyle,
        });

        return lineData;
    }
And additional little question. How can I make CursorModifier visible or not?
            <s:SciChartSurface.ChartModifier>
                <s:ModifierGroup>
                    <s:SeriesValueModifier/>
                    <s:CursorModifier/>
                </s:ModifierGroup>
            </s:SciChartSurface.ChartModifier>
Even if I make it like this
                <s:SciChartSurface.ChartModifier>
                    <s:ModifierGroup>
                        <s:SeriesValueModifier/>
                        <s:CursorModifier Visibility="Hidden"/>
                    </s:ModifierGroup>
                </s:SciChartSurface.ChartModifier>
I see it
- Fedor Iudin asked 3 months ago
- last active 2 months ago
I’m trying to set the visible range property of a CategoryDateTimeAxis through MVVM. I’m following the general instructions detailed here for converting between pixel & data coordinates on the axis:
https://www.scichart.com/questions/question/categorydatetimeaxis-in-mvvm#sabai-inline-nav
I have the following code in my viewmodel:
XAxis.OnBeginRenderPass();
var calc = XAxis.GetCurrentCoordinateCalculator();
var coordCalc = calc as ICategoryCoordinateCalculator;
XAxis is a CategoryDateTimeAxis injected from the view. I call OnBeginRenderpass as I saw in another forum post that this will ensure that the CoordinateCalculator is initialized.
calc shows in the debugger as:
- calc {A.} Abt.Controls.SciChart.Numerics.CoordinateCalculators.ICoordinateCalculator {A.}
The coordCalc variable ends up assigned to NULL, as the ICoordinateCalculator< double > cannot be cast to the interface.
How do I accomplish the above?
Thanks, Asher
- ashernew asked 8 years ago
- last active 8 years ago
Hello,
how can i implement a vertically stacked y axis chart like in your example (WPF Chart Vertically Stacked YAxis) with MVVM and a varying number of y axes. Your example has a fixed number of y axes and the needed YAxesPanel is directly implemented in your xaml code. What is the best way to achieve the same result with a varying number of y axis?
Best regards
Alexander
- Alexander Lipp asked 5 years ago
- last active 5 years ago
Hello,
I’m currently rewriting a program in .net7 WPF using MVVM as much as possible.
In my MainViewModel:
I read data from a CSV file and transforming it into an ObservableCollection of LineRenderableSeriesViewModel (stored in the « RenderableSeriesViewModels » variable) . Additionally, the Y axes are transformed into ObservableCollection of IAxisViewModel (within the « Yaxes » variable).
Each series corresponds to a LineRenderableSeriesViewModel and each Y axis is represented as a NumericAxisViewModel. The X-axis is a DateTime common to all series and is declared only in XAML.
Within my view’s XAML:
I declare RenderableSeries=”{s:SeriesBinding RenderableSeriesViewModels}” and YAxes=”{s:AxesBinding YAxes}. I’ve defined a legend template to add several elements:
– DataContext=”{Binding RenderableSeries}”
– A checkbox to toggle serie visibility (IsVisible binding).
– A checkbox to toggle Y-axis visibility for the serie (YAxis.Visibility binding).
– A color picker to change the color of a serie, bound to “Stroke”, “YAxis.TickTextBrush”, and “YAxis.BorderBrush”
– A slider for adjusting serie thickness (StrokeThickness binding).
Results:
Each element acts on the graph as expected: RenderableSeries updates and the graph refreshes correctly.
In the MainViewModel, RenderableSeriesViewModels and YAxes are not updated for all elements:
– “IsVisible” and “StrokeThickness” for the concerned series are instantly modified in RenderableSeriesViewModels but “Stroke” is not.
– “YAxes” is not updated.
The code for the LegendTemplate and a screenshot of the resulting legend are in the attachements.
Could you please help me to understand what I do wrong?
- Nicolas MARTINEZ asked 6 months ago
- last active 5 months ago
Hi,
I’m creating a CustomChartModifier which I am able to hook to a SciStockChart (a template item in a SciChartGroup MVVM) and now I’m having difficulties in adding the BoxAnnotation to the Chart.
This is the code I’m using in my ChartModifier and placing a breakpoint shows me that indeed the code runs through this method, however, I do not see any BoxAnnotation on my chart? I’ve even tried adding the Height and Width properties without any further success. Other CustomModifiers to draw Lines and Ellipses works without problems. Do BoxAnnotations work differently?
I’m looking to have the the user be able to draw a BoxAnnotation on the chart, free hand / dynamically.
SimpleBoxAnnotationModifier.cs
public override void OnModifierMouseDown(ModifierMouseArgs e)
{
        base.OnModifierMouseDown(e);

        var resources = new AnnotationStyles();
        // x:Key="BoxAnnotationStyle" TargetType="s:BoxAnnotation"
        var style = (Style)resources["BoxAnnotationStyle"];

        _annotationCreation = new AnnotationCreationModifier () { AnnotationType = typeof(BoxAnnotation), AnnotationStyle = style };

        this.ModifierSurface.Children.Add(_annotationCreation);
}
AnnotationStyles.xaml
<ResourceDictionary xmlns="http://schemas.microsoft.com/winfx/2006/xaml/presentation"
                xmlns:x="http://schemas.microsoft.com/winfx/2006/xaml"
                xmlns:s="http://schemas.abtsoftware.co.uk/scichart"
                x:Class="ChartModifierBinding.AnnotationStyles">

<Style x:Key="BoxAnnotationStyle" TargetType="s:BoxAnnotation">
    <Setter Property="BorderBrush" Value="#279B27"/>
    <Setter Property="Background" Value="#551964FF"/>
    <Setter Property="BorderThickness" Value="1"/>
    <Setter Property="IsEditable" Value="True"/>
</Style>
Thanks for any pointers or tips!
- David T asked 9 years ago
- last active 8 years ago
Hi all,
I am trying to save a copy of my chart in form of a “Png” image. However I keep getting the following exception:
“Element already has a logical parent. It must be detached from the old parent before it is attached to a new one”
I was wondering if anyone could help me passing through this.
Here is what I do:
I have a main chart surface in my program of which properties are bound to my ViewModel. For instance, as can be seen from the snippet below, my SciChartSurface’s YAxes is bound to an AxisCollection that resides in my ViewModel. Same thing is done for the RenderableSeries, Annotations, ChartModifierGroup, ChartVisibility and the XAxis properties of my Chart Surface:
<sci:SciChartSurface Grid.Row="1" Grid.Column="0"
                         RenderableSeries="{Binding SciChartSeriesViewModels}"
                         Padding="0,8,0,2"
                         sci:ThemeManager.Theme="BrightSpark"
                         YAxes="{Binding SciChartYAxesCollection, Mode=TwoWay}"
                         AutoRangeOnStartup="True"
                         Annotations="{Binding ChartAnnotations}"
                         x:Name="ApplicationSciChart"
                         ChartModifier ="{Binding ChartModifierGroup}"
                         BorderBrush="LightSlateGray"
                         BorderThickness="1"
                         Visibility="{Binding ChartVisibility}"
                         XAxis="{Binding SciChartXAxis}">
    </sci:SciChartSurface>
Now, In order to save a copy of my chart into a “Png” file, I created a new SciChartsurface in my Viewmodel. This newly created chart is desired to be rendered in the memory so I can save it as an Image (Very similar to what is instructed in: Screenshots, Printing and Export to XPS Traingin module. Somewhere in my ViewModel, after I generated all the required data for creating my chart, I call a function to form a new SciChart (rendered in memory) and perform the saving action:
private void SaveChart()
    {
        SciChartSurface AppSciChart = new SciChartSurface()
        {
            RenderableSeries = SciChartSeriesViewModels,
            XAxis = new TimeSpanAxis(),
            YAxes = SciChartYAxesCollection,
            ChartTitle = "Rendered in memory",
            Annotations = ChartAnnotations
        };

        var parent = AppSciChart.Parent;
        AppSciChart.Width = 1920;
        AppSciChart.Height = 1080;

         ThemeManager.SetTheme(AppSciChart, "BrightSpark");
         AppSciChart.ExportToFile("C:\\Chart.png",SciChart.Core.ExportType.Png, false);

    }
The RenderableSeries, YAxis and Annotations of the Chart Surface in the above code (AppSciChart) are the same as the ones I used for my main chart in my XAML code (First Snippet above).
My main chart surface in my application shows up fine, and performs what it is supposed to, but as soon as the SaveChart() is called, the program stops with an Unhandled Exception: System.InvalidOperationException: ‘Element already has a logical parent. It must be detached from the old parent before it is attached to a new one.’
I was wondering if anybody could let me know what I am possibly missing here!
Many thanks!
- Ehsan Masnavi asked 6 years ago
- last active 5 years ago
Hi! I have problems with visible range managing of a polar plot
The code in xaml:
<s:SciChartSurface graphModule:PlotLengthHelper.PlotLength="{Binding PlotLength, Mode=OneWayToSource,   UpdateSourceTrigger=PropertyChanged}"
                       x:Name="ChartSurface"
                       SizeChanged="ChartSurface_OnSizeChanged"
                        ChartTitle="{Binding ChartTitle}"
                       s:ThemeManager.Theme="BrightSpark"
                        Annotations="{s:AnnotationsBinding Annotations}"
                       RenderableSeries="{s:SeriesBinding Series}"
                       XAxes="{s:AxesBinding XAxes}"
                       YAxes="{s:AxesBinding YAxes}"
First example. The code of the axis:
    var yAxis = new PolarYAxisViewModel {AutoRange = AutoRange.Never};
    YAxes.Add(yAxis);
Changing the VisibleRange of the axis has no any effect on the visible range of the graph. It sets automatically in the very first time and remains the same.
Second example.
    var yAxis = new PolarYAxisViewModel {AutoRange = AutoRange.Always};
    YAxes.Add(yAxis);
Changing the data (using line series) again has no any effect on the visible range of the graph. Again, it sets automatically in the very first time and remains the same.
Any suggestion on how to fix it? Especially the first case is required. Thanks.
- Alexander Erkabaev asked 6 years ago
- last active 6 years ago
I am trying out SciChart ( and WPF ) for a large dataset and till so far very pleased with the results. I have followed the example as described here http://support.scichart.com/index.php?/Knowledgebase/Article/View/17258/0/creating-a-custom-scichartoverview-with-many-series-using-the-scrollbar-api and can successfully view my bound data and everything is perfect for the first instance.
However, when I assign this usercontrol to different tabs they still somehow share data about the viewstate ( the overview window does not resize, and the slider thing in front of it stays at the same values. My guess is that it has to do with the messages in ActualSizePropertyProxy , but since I am new to SciChart and WPF I was hoping that maybe someone here knows what it is.
Thanks.
- Michel Moe asked 9 years ago
- last active 4 years ago
There doesn’t seem to be a corresponding IRenderableSeries3DViewModel object like there is in the 2D charts. What am i suppose to bind to the RenderableSeries property of the SciChart3DSurface? If I bind to a
ObservableCollection<IRenderableSeriesViewModel>
object, then I don’t see a corresponding SurfaceMeshRenderableSeries3DViewModel object similar to LineRenderableSeriesViewModel for 2D?
A simple example of series binding using 3D charts would be great!
- Andy None asked 7 years ago
- last active 5 years ago
How can I apply my style and template to my axes if I created the axes as NumericAxisViewModel in code and bound them to my SciChartSurface in my xaml view?
Regards,
Roland
- Roland D asked 5 years ago
- last active 2 years ago
How to programmatically add Scrollbars to MVVM instantiated axes?
I added DateTimeAxisViewModel and NumericAxisViewModel to my code. That works from so far. A way to add scrollbars i couldnt find a some tries.
Are there some ways to get this done? Maybe change the templates of the axes or the chart?
Best regards
- Alexander Buhles asked 6 years ago
- last active 9 months ago
Hello support team.
I have a question about the resampling modes and their behavior.
I have a LineRenderableSeries with the resampling mode.mid. Therefore, depending on the zoom level and available pixels of the display screen, the information of the min and max values are lost. I had the idea to create a second LineRenderableSeries with the Opacity 0.5 and the ResamplingMode.Min Max. Thus I have behind the main line with the resampling mode.mid a “cloud” with the MinMax info. This allows the user to see this information as well. However, I would deactivate this cloud if it is not necessary due to the zoom level and the pixels.
How can I request this from SciChartControl? Or does it make more sense to use a different functionality?
I use the Mvvm classes LineRenderableSeriesViewModel, and XyDataSeries.
Thank you very much!
- Andreas Köhler asked 6 years ago
- last active 6 years ago
Hi,
I’m experimenting with the LegendModifier and want to control which RenderableSeries are shown via the “LegendItemTemplate” approach. The idea is to add a specific tagging class to the RenderableSeries.DataSeries.Tag and use the content inside the LegendItemTemplate which I define in the Window.Resouces.
The tagging Class:
public class DataSeriesTag
{
    public string LegendText { get; set; }
    public bool ShowLegend { get; set; }
}
The LegendItemTemplate:
<Window.Resources>
<Grid.ColumnDefinitions>
</Grid.ColumnDefinitions>
            <!--<CheckBox Width="16" Margin="5,0,0,0"
                HorizontalAlignment="Left"
                VerticalAlignment="Center"
                IsChecked="{Binding RenderableSeries.IsVisible, Mode=TwoWay}"
                Visibility="{Binding RenderableSeries.DataSeries.Tag.ShowLegend, Converter={dxmvvm:BooleanToVisibilityConverter}}" />-->

            <s:PointMarker Grid.Column="1" Margin="5,0,0,0" Width="40" Height="10" VerticalAlignment="Center" HorizontalAlignment="Center"
              DataContext="{Binding RenderableSeries}"
              DeferredContent="{Binding LegendMarkerTemplate}"
              Visibility="{Binding ShowSeriesMarkers, RelativeSource={RelativeSource AncestorType=s:SciChartLegend}, Converter={dxmvvm:BooleanToVisibilityConverter}}" />

            <TextBlock Margin="5,0,5,0"
     Grid.Column="2"
     HorizontalAlignment="Left"
     Text="{Binding RenderableSeries.DataSeries.Tag.LegendText}" />

        </Grid>
    </DataTemplate>
</Window.Resources>
As long as I declare the SciChartSurface.ChartModifier in XAML, it works perfect.
The proplem raises when I bind the ModifierGroup to a ViewModel Property and try to build the LegendModifier there. How can I assign the LegendItemTemplate in the ViewModel?:
legendModifier = new LegendModifier(){
            ShowLegend = true,
            ShowVisibilityCheckboxes = false,
            LegendItemTemplate = ??????
        };
        TheModifiers.ChildModifiers.Add(legendModifier);
Kind regards
Martin
- Martin Mohr asked 4 years ago
- last active 4 years ago
Previously I used AnnotationCreationModifier and my custom annotations were added by one left button mouse click on the chart surface (the annotation was added to the collection and the event handler “AnnotationCreated” fired). Now I’m trying to switch to using the mvvm pattern and I have problems adding my custom annotations using AnnotationCreationModifierMVVM.
Now it works like this:
1) I click (mouse left button) on the chart surface to add an annotation and it is added to the collection and displayed.
2) I click on the chart surface again, and only after that the event handler “AnnotationCreated” is called.
If I carry out some external manipulations with the added annotation between first and second click (for example, moving to the given coordinates by the button click), annotation moved, but when I hover the mouse over the chart surface, it returns to it’s original position. And this behavior will be until I click again on the chart surface so that the event handler “AnnotationCreated” is called.
The built-in annotations work fine though (for examle, VerticalLineAnnotationViewModel or HorizontalLineAnnotationViewModel are successfully added to the collection and call the event handler “AnnotationCreated” by one click on chart surface).
Is it possible to somehow fix this behavior of the custom annotation so that it is added to the collection and triggers an event “AnnotationCreated” for one click on the chart surface, as was the case with AnnotationCreationModifier? I am attaching an example code:
MainWindow.xaml
<Window x:Class="WpfAppMvvm.MainWindow"
    xmlns="http://schemas.microsoft.com/winfx/2006/xaml/presentation"
    xmlns:s="http://schemas.abtsoftware.co.uk/scichart"
    xmlns:ext="http://schemas.abtsoftware.co.uk/scichart/exampleExternals"
    xmlns:d="http://schemas.microsoft.com/expression/blend/2008"
    xmlns:x="http://schemas.microsoft.com/winfx/2006/xaml"
    xmlns:mc="http://schemas.openxmlformats.org/markup-compatibility/2006"
    xmlns:i="clr-namespace:System.Windows.Interactivity;assembly=System.Windows.Interactivity"
    mc:Ignorable="d"
    Title="MainWindow" Height="450" Width="800">
<Grid>
    <s:SciChartSurface Annotations="{s:AnnotationsBinding Annotations}">
        <s:SciChartSurface.XAxis>
            <s:NumericAxis AxisTitle="X"/>
        </s:SciChartSurface.XAxis>
        <s:SciChartSurface.YAxis>
            <s:NumericAxis AxisAlignment="Left" AxisTitle="Y"/>
        </s:SciChartSurface.YAxis>
        <s:SciChartSurface.ChartModifier>
            <s:ModifierGroup>
                <s:AnnotationCreationModifierMVVM IsEnabled="True" AnnotationViewModelsCollection="{Binding Annotations}" AnnotationViewModelType="{Binding AnnotationType}">
                    <i:Interaction.Behaviors>
                        <ext:EventToCommandBehavior Command="{Binding AnnotationCreatedCommand}" Event="AnnotationCreated" PassArguments="True"/>
                    </i:Interaction.Behaviors>
                </s:AnnotationCreationModifierMVVM>
            </s:ModifierGroup>
        </s:SciChartSurface.ChartModifier>
    </s:SciChartSurface>
</Grid>
MainWindow.xaml.cs
using System.Windows;
namespace WpfAppMvvm
{
    public partial class MainWindow : Window
    {
        public MainWindow()
        {
            InitializeComponent();
            DataContext = new MainWindowViewModel();
        }
    }
}
MainWindowViewModel.cs
using SciChart.Charting.ChartModifiers;
using SciChart.Charting.Common.Helpers;
using SciChart.Charting.Model.ChartSeries;
using SciChart.Examples.ExternalDependencies.Common;
using System;
using System.Collections.ObjectModel;
using System.Windows;
namespace WpfAppMvvm
{
    internal class MainWindowViewModel:BaseViewModel
    {
        public ObservableCollection<IAnnotationViewModel> Annotations { get; private set; }
        public Type AnnotationType { get; private set; }
        public ActionCommand<AnnotationCreationMVVMArgs> AnnotationCreatedCommand { get; private set; }

        public MainWindowViewModel()
        {
            Annotations = new ObservableCollection<IAnnotationViewModel>();
            AnnotationType = typeof(MyCustomAnnotationViewModel);
            AnnotationCreatedCommand = new ActionCommand<AnnotationCreationMVVMArgs>(ExecCmd, e => true);
        }
        private void ExecCmd(AnnotationCreationMVVMArgs e)
        {
            MessageBox.Show("OnAnnotationCreated executed");
        }
    }
}
MyCustomAnnotation.xaml
<s:CustomAnnotationForMvvm x:Class="WpfAppMvvm.MyCustomAnnotation"
         xmlns="http://schemas.microsoft.com/winfx/2006/xaml/presentation"
         xmlns:x="http://schemas.microsoft.com/winfx/2006/xaml"
         xmlns:mc="http://schemas.openxmlformats.org/markup-compatibility/2006"
         xmlns:d="http://schemas.microsoft.com/expression/blend/2008"
         mc:Ignorable="d"
         xmlns:s="http://schemas.abtsoftware.co.uk/scichart"
         d:DesignHeight="450" d:DesignWidth="800">
<Grid>
    <Ellipse
        Width="20"
        Height="20"
        Fill="Transparent"
        Stroke="Red"
        StrokeThickness="3"
    />
</Grid>
MyCustomAnnotation.xaml.cs
using SciChart.Charting.Visuals.Annotations;

namespace WpfAppMvvm
{
    public partial class MyCustomAnnotation : CustomAnnotationForMvvm
    {
        public MyCustomAnnotation()
        {
            InitializeComponent();
        }
    }
}
MyCustomAnnotationViewModel.cs
using SciChart.Charting.Model.ChartSeries;
using System;

namespace WpfAppMvvm
{
    public class MyCustomAnnotationViewModel:CustomAnnotationViewModel
    {
    public override Type ViewType => typeof(MyCustomAnnotation);
    }
}
- Maksim Rumyantsev asked 1 year ago
- last active 2 months ago
Hi,
CompositeAnnotation works perfectly and easy to use, but I need it in MVVM. CompositeAnnotationViewModel looks the same, but it is not visible. This is my code:
AnnotationViewModels.Add(new CompositeAnnotationViewModel()
{
    Annotations = new ObservableCollection<IAnnotationViewModel>()
    {
        new VerticalLineAnnotationViewModel
        {
            VerticalAlignment = VerticalAlignment.Stretch,
            Stroke = Colors.Blue,
            StrokeThickness = 2,
            IsEditable = true,
            StrokeDashArray = new DoubleCollection() { 2, 2 },
            CoordinateMode = AnnotationCoordinateMode.Relative,
            X1 = 0
        },
        new VerticalLineAnnotationViewModel
        {
            VerticalAlignment = VerticalAlignment.Stretch,
            Stroke = Colors.Blue,
            StrokeThickness = 2,
            IsEditable = true,
            StrokeDashArray = new DoubleCollection() { 2, 2 },
            CoordinateMode = AnnotationCoordinateMode.Relative,
            X1 = 1
        }
    },
    IsEditable = true,
    X1 = 3,
    X2 = 5
});
What is my mistake?
- Alexander Erkabaev asked 6 years ago
- last active 6 years ago
Getting an exception when trying to add tooltip template MVVM style to a blox plot. The chart also contains a scatter plot which should not be styled. That works fine, hoverwer, when I move the mouse over a box in the box plot, the exception is thrown.
I want to keep the styling, I just want to write something different than the default text.
The template:
  <DataTemplate DataType="scalarPlot:ToolTipData" x:Key="BoxSeriesTooltipTemplate">
    <TextBlock>
      <Run Text="Max:      " />
      <Run Text="{Binding Maximum}" />
      <LineBreak />
      <Run Text="P90:       " />
      <Run Text="{Binding P90}" />
      <LineBreak />
      <Run Text="Median: " />
      <Run Text="{Binding Median}" />
      <LineBreak />
      <Run Text="P10:       " />
      <Run Text="{Binding P10}" />
      <LineBreak />
      <Run Text="Min:       " />
      <Run Text="{Binding Minimum}" />
      <LineBreak />
    </TextBlock>
  </DataTemplate>
The binding:
      <Style TargetType="s:BaseRenderableSeries" x:Key="BoxSeriesStyle">
        <Setter Property="s:TooltipModifier.TooltipTemplate" Value="{StaticResource BoxSeriesTooltipTemplate}"/>
        <Setter Property="s:TooltipModifier.IncludeSeries" Value="True"/>
      </Style>
The modifier:
<s:SciChartSurface.ChartModifier>
      <s:ModifierGroup>
        <s:TooltipModifier IsEnabled="True" ShowTooltipOn="Always" ReceiveHandledEvents="True" TooltipLabelDataContextSelector="{Binding ToolTipDataContext}"/>
      </s:ModifierGroup>
    </s:SciChartSurface.ChartModifier>
The view model:
    private static IRenderableSeriesViewModel CreateBoxPlotViewModel(BoxPlotDataSeries<int, float> boxPlotDataSeries)
    {
        return new BoxPlotRenderableSeriesViewModel
        {
            DataSeries = boxPlotDataSeries,
            Stroke = Colors.SteelBlue,
            Fill = new LinearGradientBrush(Colors.White, Colors.LightSteelBlue, new System.Windows.Point(0, 0), new System.Windows.Point(0.5, 1)),
            StyleKey = "BoxSeriesStyle"
        };
    }
The data context selector:
    public Func<SeriesInfo, object> ToolTipDataContext
    {
        get
        {
            return seriesInfo =>
                   {
                       return seriesInfo switch
                       {
                           BoxPlotSeriesInfo boxInfo =>
                               new ToolTipData
                               {
                                   Fill = seriesInfo.Fill,
                                   Stroke = seriesInfo.Stroke,
                                   Maximum = (float) boxInfo.MaximumValue,
                                   P90 = (float) boxInfo.UpperQuartileValue,
                                   Median = (float) boxInfo.MedianValue,
                                   P10 = (float) boxInfo.LowerQuartileValue,
                                   Minimum = (float) boxInfo.MinimumValue
                               },
                           _ => seriesInfo
                       };
                   };
        }
    }
- Tore Munch asked 3 years ago
- last active 3 years ago
I am directly editing my XyDataSeries on a chart by using my mouse. As the mouse moves I edit either the x or y value of a point using the methods
    public void SetPointYValueAt(IDataSeries series, int index, double newValue)
    {
        series.YValues[index] = newValue;
        series.InvalidateParentSurface(RangeMode.None);
    }

    public void SetPointXValueAt(IDataSeries series, int index, double newValue, double xMin, double xMax)
    {
        var xValue = newValue;

        // limit x values to keep them sorted
        if (xValue < xMin) xValue = xMin;
        if (xValue > xMax) xValue = xMax;
        series.XValues[index] = xValue;

        series.InvalidateParentSurface(RangeMode.None);
    }
With this code I am not getting an update at my ViewModel:
    public IDataSeries<double, double> MyDataSeries
    {
        get { return _myDataSeries; }
        set
        {
            _myDataSeries = value;
            OnPropertyChanged("MyDataSeries");
        }
    }
Here is my XAML:
<sciChartExtensions:StepLineRenderableSeries x:Name="HResitivitySeries" IsDigitalLine="True" DataSeries="{Binding MyDataSeries, Mode=TwoWay}">
Where StepLineRenderableSeries is derived from FastLineRenderableSeries with IsDigitalLine = true and the HitTest method overridden.
How can I get MyDataSeries to update?
- Stephen Painchaud asked 9 years ago
- last active 9 years ago
Hello,
My goal is to have the user select a series with a mouse click, and to see which series was selected while following the MVVM pattern. I am filling in the DataSeries using a LineSeriesSource attached behaviour.
What I tried so far is to attach to the SelectionChanged event of a Renderable series with an Interaction Trigger.
This doesn’t work:
        <SciChart:SciChartSurface.ChartModifier>

            <SciChart:ModifierGroup>

                <SciChart:SeriesSelectionModifier >
                    <i:Interaction.Triggers>
                        <i:EventTrigger EventName="SelectionChanged" >
                            <i:InvokeCommandAction Command="{Binding Path=cmdSelectedSeriesChanged}" CommandParameter="{Binding Path=SelectedSeries}"/>
                        </i:EventTrigger>
                    </i:Interaction.Triggers>
                    <SciChart:SeriesSelectionModifier.SelectedSeriesStyle>
                        <Style TargetType="SciChart:BaseRenderableSeries">
                            <Setter Property="Stroke" Value="White"/>
                            <Setter Property="StrokeThickness" Value="2"/>
                        </Style>
                    </SciChart:SeriesSelectionModifier.SelectedSeriesStyle>
                </SciChart:SeriesSelectionModifier>

        </SciChart:ModifierGroup>
        </SciChart:SciChartSurface.ChartModifier>
This works, but is not what I want since it’s not MVVM:
<SciChart:SciChartSurface.ChartModifier>

                <SciChart:ModifierGroup>

                    <SciChart:SeriesSelectionModifier SelectionChanged="SeriesSelectionModifier_SelectionChanged">

                        <SciChart:SeriesSelectionModifier.SelectedSeriesStyle>
                            <Style TargetType="SciChart:BaseRenderableSeries">
                                <Setter Property="Stroke" Value="White"/>
                                <Setter Property="StrokeThickness" Value="2"/>
                            </Style>
                        </SciChart:SeriesSelectionModifier.SelectedSeriesStyle>
                    </SciChart:SeriesSelectionModifier>

            </SciChart:ModifierGroup>
            </SciChart:SciChartSurface.ChartModifier>
Interaction Propety cannot be attached to SciChartSurface.RenderableSeries.
I also tried attaching the Interaction Property to an individual DataSeries, which is definitely not what I want to do, but it doesn’t work either.
/Tomasz
- Tomasz Cholewinski asked 8 years ago
- last active 8 years ago
Hi
I’m trying to use AvaloniaUI with .NET Core 3.1 to create an application using SciChart, but I get XAMLIL error when trying to add a SciChartSurface following the code from the tutorial. I used a standard Avalonia MVVM Application template when creating the project.
This is the code:
<UserControl xmlns="https://github.com/avaloniaui"
             xmlns:s="http://schemas.abtsoftware.co.uk/scichart"
             xmlns:x="http://schemas.microsoft.com/winfx/2006/xaml"
             xmlns:d="http://schemas.microsoft.com/expression/blend/2008"
             xmlns:mc="http://schemas.openxmlformats.org/markup-compatibility/2006"
             mc:Ignorable="d" d:DesignWidth="800" d:DesignHeight="450"
             x:Class="FF_DataVis_Avalonia_MVVM.Views.TabControlView">

    <Grid>
        <!-- Bind to ChartViewModel.ChartTitle etc -->
        <s:SciChartSurface ChartTitle="{Binding ChartTitle}">
            <s:SciChartSurface.XAxis>
                <s:NumericAxis AxisTitle="{Binding XAxisTitle}"/>
            </s:SciChartSurface.XAxis>
            <s:SciChartSurface.YAxis>
                <s:NumericAxis AxisTitle="{Binding YAxisTitle}"/>
            </s:SciChartSurface.YAxis>
        </s:SciChartSurface>
    </Grid>
</UserControl>
And the error I get is:
“XAMLIL: Unable to resolve type SciChartSurface from namespace http://schemas.abtsoftware.co.uk/scichart Line 27, position 4″
which is the first s:SciChartSurface entry.
Any ideas what might be wrong? Does SciChart not work with any framework regardless of using .NET Core 3.0?
I have tried changing between Core 3.0 and 3.1, which does nothing.
- Magnus Aarnes asked 3 years ago
- last active 4 months ago
Hi sir,
We would like to build a real time updated stackedcolumn chart in mvvm mode.
Is that possible? (x-axis on the left side)(y-axis on the bottom side which can keep update with only 10mins range)
I wonder can I use the StackedColumnRenderableSeriesForMvvm?
I found out this control but have no idea how to use it…
- Wade Yao asked 3 years ago
- last active 3 years ago
I think this is a pretty simple question but i am not sure what i am missing.I have a toggle button on my legend that is intended to allow the users to select all the series or deselect all the series.
the button essentially goes through the Renderable series view models and set the IsSelected to either true or false, this approach however, doesn’t work. I looked at the SelectionModifier and i can see that has a protected DeselectAll method and i am thinking to leverage that to solve this use case.
what is the best solution to accomplish this? isn’t this functionality something that perhaps be standard and could just be turned on?
- Joseph McClean asked 6 years ago
- last active 6 years ago
Hello Scichart Team,
Can you guys provide me with some guidance to implement a custom IRenderableSeriesViewModel implementation that is supported in MVVM binding in Scichartsurface? Specifically, I’m looking to create a chart series that can be bound to my ViewModel and support custom styling and data handling.
I have tried following the tutorial found here…
Worked Example – CustomRenderableSeries in MVVM
https://www.scichart.com/documentation/win/current/webframe.html#Worked%20Example%20-%20CustomRenderableSeries%20in%20MVVM.html
I was getting a cast error from scicharts. I have attached the picture showing the detailed error.
Concerning the XAML code I have tried both the normal Binding keyword and s:SeriesBinding keyword to the RenderableSeries in the SciChartSurface.
Let me know how to go about this!
- Arjun Sivaprasadam asked 1 year ago
- last active 1 year ago
We are using the VerticalLineAnnotation and want to change it’s location (X1 property) in the viewmodel.
Annotations are bound like this:
<s:SciChartSurface
           ...
           Annotations="{s:AnnotationsBinding Annotations}"
to the property:
public ObservableCollection<IAnnotationViewModel> Annotations { get; private set; }
The collection contains this association:
this.nowAnnotation = new VerticalLineAnnotationViewModelEx()
        {
            X1 = TimeSpan.FromSeconds(0),
            StyleKey = "NowAnnotationStyle"
        };
To change the location we change the value of X1:
nowAnnotation.X1 = value;
Calling that didn’t have a direct effect on the UI unless the user does any action which redraws the chart.
We created a style which sets an attached property to pass the VerticalLineAnnotation to the view model, this works fine.
<Style TargetType="s:VerticalLineAnnotation" x:Key="NowAnnotationStyle">
                    <Setter Property="viewModels:VerticalLineAnnotationViewModelEx.PassIAnnotation" Value="True" />
                </Style>
And we added a Refresh method to VerticalLineAnnotationViewModelEx and call it after setting X1:
nowAnnotation.X1 = value;
nowAnnotation.Refresh();
The first implementation of the Refresh method we did was:
public void Refresh()
    {
        this.Annotation.Refresh();
    }
From the documentation this should redraw the annotation without redrawing the whole chart, but it had no effect.
https://www.scichart.com/documentation/win/current/webframe.html#SciChart.Charting~SciChart.Charting.Visuals.Annotations.AnnotationBase~Refresh.html
It only started working after changing to this:
public void Refresh()
    {
        this.Annotation.ParentSurface.InvalidateElement();
    }
Is there a better way to do it, shouldn’t the first implementation work?
The complete code of VerticalLineAnnotationViewModelEx
public class VerticalLineAnnotationViewModelEx : VerticalLineAnnotationViewModel
{
    public static readonly DependencyProperty PassIAnnotationProperty = DependencyProperty.RegisterAttached(
        "PassIAnnotation", typeof(bool), typeof(VerticalLineAnnotationViewModelEx),
        new PropertyMetadata(default(bool), OnPassIAnnotationChanged));

    public IAnnotation Annotation { get; private set; }

    private static void OnPassIAnnotationChanged(DependencyObject d, DependencyPropertyChangedEventArgs e)
    {
        var verticalLineAnnotation = (VerticalLineAnnotation)d;
        ((VerticalLineAnnotationViewModelEx)verticalLineAnnotation.DataContext).Annotation = (IAnnotation)d;
    }

    public static void SetPassIAnnotation(DependencyObject element, bool value)
    {
        element.SetValue(PassIAnnotationProperty, value);
    }

    public static bool GetPassIAnnotation(DependencyObject element)
    {
        return (bool)element.GetValue(PassIAnnotationProperty);
    }

    public void Refresh()
    {
        //this.Annotation?.Refresh();
        this.Annotation?.ParentSurface.InvalidateElement();
    }
}
- AC42admin LMB asked 8 months ago
- last active 8 months ago
I am using the MVVM pattern.
I trying to manage the number of YAxes in my chart in a dynamic manner by binding the YAxes in the chart to a collection so that each time I add a new line series that line series gets its own axis.
When I do this I am getting a null reference expection.
If I hard code the YAxes or YAxis my chart loads.
Here is the xaml:
<SciChart:SciChartSurface x:Name="historicalChart"
    RenderableSeries="{Binding HistoricalRenderableSeries, Mode=TwoWay}"
    YAxes="{Binding ChartYAxes, Mode=TwoWay}"
    SciChart:ThemeManager.Theme="ExpressionLight">
   ...
</s:SciChartSurface>
Here is the ViewModel
I tried both an ObservableCollection and a AxisCollection in my view model.
private ObservableCollection<NumericAxis> _chartYAxes = new ObservableCollection<NumericAxis>();
public ObservableCollection<NumericAxis> ChartYAxes
{
  get { return _chartYAxes; }
  set
  {
    _chartYAxes = value;
    NotifyPropertyChanged("ChartYAxes");
  }
}

private AxisCollection _chartYAxes = new AxisCollection();
public AxisCollection ChartYAxes
{
  get { return _chartYAxes; }
  set
  {
    _chartYAxes = value;
    NotifyPropertyChanged("ChartYAxes");
  }
}
Can anyone suggest a way to manage a variable number of YAxes in a chart?
- sdemooy asked 12 years ago
- last active 9 years ago
Hello support team,
We have to realize the following request:
– Yt chart with DateTime as X-axis and double values on the Y-axis
– The chart should display a user-defined area on startup (e.g. 20 sec) After the chart has run for 20 seconds ( i.e. 20 seconds), the animated scrolling should start. By default, the chart behaves as follows: The X-axis area fills up to 20 seconds and then starts scrolling. We want the chart to display 20 seconds on the X-axis at the start and fill up.
I am aware that I can implement this behavior myself. However, the question arises whether I can realize this directly with a basic functionality.
Thank you!
- Andreas Köhler asked 6 years ago
- last active 6 years ago
Hi,
I’ve been finding lots of examples of creating Custom Chart Modifiers however they are not using a SciChartGroup using a DataTemplate and not in a MVVM scenario.
I know MVVM is the preferred structure for WPF solutions, however it does introduces some complexities as well as using DataTemplates of a SciChartGroup, therefore, would someone please be so kind as to point me in the right direction for an example or two so that I can see how this all could work together?
I’m looking at Custom Chart Modifiers by use of a CustomModifier class. As this will give me the most flexibility in terms of what I would like to do in the future and I would also like to be able to switch between modifiers, such as Panning, Zooming and drawing annotations onto the chart.
Thanks everyone!
David
P.S. Andrew, if this requires a developer on your side to hash this out for an hour or so, let me know and I’ll be more than happy to pay for it.
- David T asked 9 years ago
- last active 9 years ago
When I select a series/plot, I would like to identify where it came with more than just the Name member. How can I do that?
Background:
I have a list of unsigned integer values taken from a data logger. I bundle the values up in a class with some other information, such as the name of the sample and an ID string.
Since I can’t data bind to the logged samples as-is, I convert them to a SciChart friendly “LineRenderableSeriesViewModel” and add them to a list of “ObservableCollection” that I data bind to a SciChart.
ViewModel.cs:
// Where "loggedSamples" is a SamplesContainer
//class SamplesContainer
//{
//    public string Name;
//    public string ID;  **<=== I want to get this somehow when I select something**
//    public Uint16 data {get;set;}
//}

// Convert Samples => XyDataSeries => LineRenderableSeriesViewModel

SamplesContainer loggedSamples = GetLoggedSample();
XyDataSeries<double, double> xySeries = ConvertSamplesToXyDataSeries(loggedSamples);
xySeries.SeriesName = loggedSamples.Name;

LineRenderableSeriesViewModel lineSeries = new LineRenderableSeriesViewModel() {
    DataSeries = xySeries, StyleKey = "LineStyle", Stroke = Colors.Blue };

RenderableSeriesViewModelForChannels.Add(lineSeries);
MainWindow.xaml:
   <s:SciChartSurface Name="sciChartItemView" Grid.Column="2"
    AllowDrop="True"
    DragDrop.Drop="sciChartItemView_Drop"
    DragDrop.DragEnter="sciChartItemView_DragEnter"
    MinHeight="80"
    s:ThemeManager.Theme="BrightSpark"
    RenderableSeries="{s:SeriesBinding RenderableSeriesViewModelForChannels}"
    ViewportManager="{Binding SampleSetViewMod.ViewportManager}"
    DebugWhyDoesntSciChartRender="True"
    s:SciChartGroup.VerticalChartGroup="sharedYAxisWidth"
    >

    <s:SciChartSurface.XAxis>
        <s:NumericAxis
        DrawMajorGridLines="True"
        DrawMinorGridLines="False"
        DrawMajorBands="False"
        VisibleRange="{Binding SampleSetViewMod.SharedXVisibleRange, Mode=TwoWay}"
        Visibility="Hidden"
        TextFormatting="0.######"/>
    </s:SciChartSurface.XAxis>

    <s:SciChartSurface.YAxis>
        <s:NumericAxis AxisAlignment="Left"
        DrawMajorGridLines="False"
        DrawMinorGridLines="False"
        DrawMajorBands="False"
        Visibility="Visible">
            <s:NumericAxis.GrowBy>
                <s:DoubleRange Min="0.1" Max="0.1" />
            </s:NumericAxis.GrowBy>
        </s:NumericAxis>

    </s:SciChartSurface.YAxis>

    <s:SciChartSurface.ChartModifier>
        <s:ModifierGroup>
            <s:ZoomExtentsModifier XyDirection="YDirection"/>

            <s:ZoomPanModifier ExecuteOn="MouseMiddleButton" XyDirection="XYDirection" ClipModeX="ClipAtExtents" />

            <local:ExtendedMouseWheelZoomModifier />

            <s:RubberBandXyZoomModifier IsEnabled="True"
                IsXAxisOnly="False"
                ReceiveHandledEvents="True" />
            <s:LegendModifier ShowLegend="True" Orientation="Vertical" Margin="10"
                GetLegendDataFor="AllSeries"
                ShowVisibilityCheckboxes="False"
                HorizontalAlignment="Right"
                LegendPlacement="Inside"
                Background="White"
                />

            <local:ExtendedSeriesSelectionModifier SelectionChanged="SeriesSelectionModifier_OnSelectionChanged">
                <local:ExtendedSeriesSelectionModifier.SelectedSeriesStyle>
                    <Style TargetType="s:FastLineRenderableSeriesForMvvm">
                        <Setter Property="StrokeDashArray" Value="10,5"/>
                    </Style>
                </local:ExtendedSeriesSelectionModifier.SelectedSeriesStyle>
            </local:ExtendedSeriesSelectionModifier>


            <!--<s:CursorModifier x:Name="cursorModifier" IsEnabled="True" />
        <s:RolloverModifier x:Name="rolloverModifier" IsEnabled="True"/>-->
        </s:ModifierGroup>
    </s:SciChartSurface.ChartModifier>
</s:SciChartSurface>
- Christopher Bennet asked 7 years ago
- last active 7 years ago
Is there a way to apply functionalities on signals as in average, slope, etc. ?
Thank you
Anders
- Anders Persson asked 2 years ago
- last active 2 years ago
Good day,
we are using the VerticalSliceModifier for sorted data and it works very good.
<local:VerticalSliceModifierExt x:Name="SliceModifier">
<s:VerticalSliceModifier.VerticalLines>
    <chartModifier:SnappyVerticalLine x:Name="VerticalLine"
                          ShowLabel="False"
                          X1="0"
                          Y1="0"
                          CoordinateMode="Absolute"
                          IsEditable="True">
    </chartModifier:SnappyVerticalLine>
</s:VerticalSliceModifier.VerticalLines>
Please see the image “Example Vertical Slice Modifier”.
The challange is to have something similar for unsorted data.
One of the issues are multiple intersections. Please see the image “Multiple Intersections” where i would like be able to select what intersections shall be highlighted.
The next challange is the usage of multiple series and synchronization based on a different property (t for time). Please see “Multiple Series” image.
We already have IPointMetadata with X,Y and t to be able to find the data point to highlight.
My question: Is there already some modifier chat can help with this requirements or what would be a clean solution if we need to develop a custom modifier.
Thank you in advance
Paul
- Paul Stempel asked 5 months ago
- last active 3 months ago
I’m trying to implement custom annotations using the MVVM pattern. I’ve been using your tutorial as an example (https://www.scichart.com/databinding-annotations-with-mvvm/). Everything works as expected if I manually load some example data to the annotations collection. When I actually try to load the data from our database using async method, the annotations are no longer drawn.
Is this by design or am I doing something wrong? Do you have any suggestions how to load annotations when using async code and MVVM patterns? I haven’t had any problems loading the actual time series on the chart using the same pattern.
I also tried binding the SciChartSurface’s Annotations property to AnnotationCollection and then calling ChartAnnotations.ParentSurface.InvalidateElement(), but the issue still persists.
You can easily reproduce this behavior by adding an async call to the examples’s source code:
private async Task Initialize()
{
    var ds0 = new XyDataSeries<double, double>();
    var someData = new RandomWalkGenerator().GetRandomWalkSeries(200); // RandomWalkGenerator is found in the examples source code

    ds0.Append(someData.XData, someData.YData);

    _chartSeries = new ObservableCollection<IChartSeriesViewModel>();
    _chartSeries.Add(new ChartSeriesViewModel(ds0, new FastLineRenderableSeries()));

    // Now create the labels
    _chartLabels = new List<LabelViewModel>
                       {
                           new LabelViewModel(5, -2.5, "Label0", "Label0 Tooltip!"),
                           new LabelViewModel(20, -2, "Label1", "Label1 Tooltip!"),
                           new LabelViewModel(35, 3, "Label2", "Label2 Tooltip!"),
                           new LabelViewModel(50, 1.5, "Label3", "Label3 Tooltip!"),
                       };

    await Test();

    _chartLabels.Add(new LabelViewModel(65, -0.5, "AFTER ASYNC", "Label4 Tooltip!"));
}

private async Task Test()
{
    await Task.Delay(5000);
}
- Juho asked 7 years ago
- last active 7 years ago
Hi all,
As the title indicates, I am trying to get mouse cursor position (Coordinates) from a SciChartSurface in MVVM manner.
I have lots of data bindings to my chart properties in my View Model in the background. This following snipped is a copy of my XAML code in which I have all the data bindings set:
<sci:SciChartSurface Grid.Row="0" Grid.Column="0"
                         RenderableSeries="{Binding SciChartSeriesViewModels}"
                         Padding="0,8,0,2"
                         sci:ThemeManager.Theme="BrightSpark"
                         YAxes="{Binding SciChartYAxesCollection,Mode=TwoWay}"
                         AutoRangeOnStartup="True"
                         Annotations="{Binding ChartAnnotations}"
                         Name="ApplicationSciChart"
                         ChartModifier ="{Binding ChartModifierGroup}"
                         BorderBrush="LightSlateGray"
                         BorderThickness="1"
                         Visibility="{Binding ChartVisibility}">

        <sci:SciChartSurface.XAxis>
            <sci:TimeSpanAxis AxisTitle="Time"
                              AutoRange="Once" GrowBy="0.03,0.001"
                              TextFormatting=""/>
        </sci:SciChartSurface.XAxis>

  </sci:SciChartSurface>
As can be seen from the code above, the ChartModifier property is one of the items that has Data binding to an instance of a ModiferGroup I have created in my View-Model in the background. The following code is a method that adds members to that ModiferGroup (called ChartModiferGroup in my View-Model):
 private void CreateChartModifiers()
    {
        var rubberBandXyZoomModifier = new RubberBandXyZoomModifier
        {
            ExecuteOn = SciChart.Charting.ChartModifiers.ExecuteOn.MouseLeftButton,
            RubberBandFill = (SolidColorBrush)(new BrushConverter().ConvertFrom("#33FFFFFF")),
            RubberBandStroke = Brushes.SteelBlue,
            RubberBandStrokeDashArray = new DoubleCollection {2.0, 2.0}
        };

        var zoomPanModifier = new ZoomPanModifier
        {
            ExecuteOn = SciChart.Charting.ChartModifiers.ExecuteOn.MouseMiddleButton,
            ClipModeX = SciChart.Charting.ClipMode.None
        };

        var yAxisDragModifier = new YAxisDragModifier
        {
            DragMode = SciChart.Charting.AxisDragModes.Scale
        };

        var xAxisDragModifier = new XAxisDragModifier
        {
            DragMode = SciChart.Charting.AxisDragModes.Pan
        };

        var mouseWheelZoomModifier = new MouseWheelZoomModifier();

        var zoomExtentsModifier = new ZoomExtentsModifier
        {
            ExecuteOn = SciChart.Charting.ChartModifiers.ExecuteOn.MouseDoubleClick
        };

        var cursorModifier = new CursorModifier
        {
            ReceiveHandledEvents = true,
            ShowAxisLabels = false
        };


        var probeline = new VerticalLineAnnotation()
        {
            Stroke = Brushes.LightSlateGray,
            IsEditable = true,
            ShowLabel = true,
            LabelPlacement = LabelPlacement.Axis,
            Visibility = Visibility.Visible,
            IsHidden = false,
            IsEnabled = true,
            X1 = TimeSpan.FromMilliseconds(-100),
            YAxisId = "Triggered",
            StrokeDashArray = new DoubleCollection { 2.0,2.0},
            StrokeThickness = 1
        };

        var verticalSliceModifier = new VerticalSliceModifier
        {
            IsEnabled = true,
            ShowAxisLabels = true,
            Style = probeline.Style
        };
        verticalSliceModifier.VerticalLines.Add(probeline);


        ChartModifierGroup.ChildModifiers.Add(rubberBandXyZoomModifier);
        ChartModifierGroup.ChildModifiers.Add(rubberBandXyZoomModifier);
        ChartModifierGroup.ChildModifiers.Add(zoomPanModifier);
        ChartModifierGroup.ChildModifiers.Add(yAxisDragModifier);
        ChartModifierGroup.ChildModifiers.Add(xAxisDragModifier);
        ChartModifierGroup.ChildModifiers.Add(mouseWheelZoomModifier);
        ChartModifierGroup.ChildModifiers.Add(zoomExtentsModifier);
        ChartModifierGroup.ChildModifiers.Add(verticalSliceModifier);
        ChartModifierGroup.ChildModifiers.Add(cursorModifier);
    }
What I am trying to do next, is to add functionality in my application, such that I can add more VerticalSliceModifiers to my ChartModifierGroup when a button is pressed. In order to do that, I will require having access to the Mouse cursor position of my SciChartSurface to set the X1 property of the VerticalLineAnnotation, that would be used for the VerticalSliceModifiers (to be created).
In simple words, every time I press a button, I need the position of the mouse pointer to get captured and used as the location of the new VerticalSliceModifer that I am going to create.
I have already read many of the examples and documentation of Sci-Chart such as: Vertical Slice Tooltips Example. However, in this example, the mouse pointer location is accessed is under the xaml.cs and not inside an actual View-Model.
I was wondering if anybody could let me know how I can get access to my SciChartSurface mouse pointer position using true MVVM model.
- Ehsan Masnavi asked 6 years ago
- last active 5 years ago
We keep getting asked What’s the best practice way to suspend the SciChartSurface in a multi-pane stock chart demo.
We have multiple ways of doing this.
- You can call SuspendUpdates on a DataSeries
- You can lock the parent surface SyncRoot etc…
- You can call SuspendUpdates on the SciChartSurface instance
By far the most effective and thread-safe way to do this is to call SuspendUpdates directly on the SciChartSurface. But how to do this in a ViewModel?
- Andrew Burnett-Thompson asked 9 years ago
- last active 9 years ago
Using MVVM, I have an AnnotationCollection databound to the SciChartSurface.Annotations. Individual LineAnnotations are added to the collection as the application code runs.
If annotations are added while the chart is displayed, they are all drawn correctly.
However, if the chart page is reloaded (say, the user navigates to a different page and then returns to the chart page), the annotations do not always redraw. If the annotations have AnnotationCanvas set to default (AnnotationCanvas.AboveChart, I believe) they redraw correctly about 50% of the time. If the annotations’ AnnotationCanvas is set to AnnotationCanvas.XAxis, they never redraw.
All the annotations still exist in the ObservableCollection in all these cases, so they shouldn’t need to be re-created.
Is this a bug in SciChart or is there something I may be doing wrong with the annotations?
(There is only one X-Axis so no axisID is necessary.)
LineAnnotation lAnno = new LineAnnotation();
lAnno.CoordinateMode = AnnotationCoordinateMode.RelativeY;
lAnno.Y1 = 0.0;
lAnno.X1 = DataPoints;
lAnno.Y2 = 1.0;
lAnno.X2 = DataPoints;
lAnno.YAxisId = "Counts";
lAnno.Foreground = new System.Windows.Media.SolidColorBrush(System.Windows.Media.Color.FromRgb(255, 255, 255));
lAnno.Stroke = new System.Windows.Media.SolidColorBrush(System.Windows.Media.Color.FromArgb(96, 255, 0, 0));
lAnno.StrokeThickness = 2;
lAnno.AnnotationCanvas = AnnotationCanvas.XAxis;

Markers.Add(lAnno);
- Matthew Becker asked 8 years ago
- last active 8 years ago
Requirements:
- Main graph updates based on the data from the selected Item.
- The data and styling is independent and the style is dynamic global style for all Items.
- The data for the graphing that is Data Series is binded to DataSet which is of type XYDataSeries<DateTime, double>.
- DataSeries data is obtained from the datacontext which implements INotifyPropertyChanged
Problem:
- The databinding is not dynamic and the data series is not updated when the selection changes.
- The initial data selection is reflected but any subsequent data changes are not reflected on the sci chart surface.
- This behavior was only for the Dataseries binding and it was verified using a textbox which binds to the count of the DataSet and this updates as the selection changes but not the dataseries.
Please suggest a work around or an alternative solution so that I can predefine axes and series but swap out the data based on the selected Item. Please see the attached xaml code below.
        <Grid>
        <Grid DockPanel.Dock="Top">
            <chart:SciChartSurface x:Name="mainView"
                                   OnRenderException="MainView_OnRenderException"
                                   Loaded="MainView_Loaded">
                <chart:SciChartSurface.YAxes>
                    <chart:NumericAxis x:Name="AxisOne"
                                       Id="Id1"
                                       AxisAlignment="Left"/>

                    <chart:NumericAxis x:Name="AxisTwo"
                                       Id="Id2"
                                       AxisAlignment="Left"/>

                </chart:SciChartSurface.YAxes>
                <chart:SciChartSurface.XAxis>
                    <chart:DateTimeAxis x:Name="DateTimeAxis"/>
                </chart:SciChartSurface.XAxis>
                <chart:SciChartSurface.RenderableSeries>
                    <chart:FastLineRenderableSeries x:Name="DataSet1FS"
                                                    DataSeries="{Binding DataSet1}"
                                                    YAxisId="Id1"
                                                    Stroke="Yellow"/>
                </chart:SciChartSurface.RenderableSeries>
            </chart:SciChartSurface>
        </Grid>
        <TextBlock Text="{Binding Path=DataSet1.Count}"
                            Margin="0 -20 0 0"
                            HorizontalAlignment="Right"
                            VerticalAlignment="Top"
                            Height="20"
                            Width="200"
                            Background="White"
                            Foreground="Black"/>
    </Grid>
- Arjun Sivaprasadam asked 1 year ago
- last active 1 year ago
Hi,
Could you provide some Mvvm examples that include:
1) Mvvm bubble chart where the Fill color is defined on the series view model
2) custom tooltips per point where the tooltip string is defined on the point view model
I have both of these kind of working using a workaround based on the obsolete SciChartSurface.SeriesSource property, but now I’m trying to migrate to SciChartSurface.RenderableSeries and the proper Mvvm API and I cannot find all the elements I need.
Cheers
Felix
- F W asked 8 years ago
- last active 8 years ago
We’re using ReactiveUI and bindings in code-behind. We’re now upgrading from SciChart v3 to v6 and we’re wondering how to use the SeriesBinding in code-behind like this:
public partial class BarChartView : ReactiveUserControl<sBarChartViewModel>
{
    public BarChartView()
    {
        InitializeComponent();

        this.WhenActivated(disposable =>
        {
            this.OneWayBind(ViewModel,
                            vm => vm.SeriesSource,
                            view => view.BarChart.SeriesSource)
                .DisposeWith(disposable);

            this.OneWayBind(ViewModel,
                            vm => vm.LabelProvider,
                            view => view.FaciesAxis.LabelProvider)
                .DisposeWith(disposable);

            this.OneWayBind(ViewModel,
                            vm => vm.TooltipDataContext,
                            view => view.TooltipModifier.TooltipLabelDataContextSelector)
                .DisposeWith(disposable);

            this.OneWayBind(ViewModel,
                            vm => vm.XAxisRange,
                            view => view.FaciesAxis.VisibleRange)
                .DisposeWith(disposable);
        });
    }
}
Now the IChartSeriesViewModel and SciChartSurface.SeriesSource is deprecated so we have to move to IRenderableSeriesViewModel instead and then bind to SciChartSurface.RenderableSeries. But how can we convert from IRenderableSeriesViewModel to IRenderableSeries here?
- Tore Munch asked 3 years ago
- last active 2 years ago
Hello,
I’m using SciChart in our WPF project. And we are Keeping Series and Annotations as RadObservableCollection(from Telerik) instead of ObservableCollection to get the benefits of RadObservableCollection. But when I’m adding or deleting data from RadObservableCollection it does not affect in charts. Does SciChart work with RadObservableCollection ? I’ve explored your examples and wasn’t able to found examples with RadObservableCollection.
- Lusine Torosyan asked 1 year ago
- last active 1 year ago
Hi,
I have several chart panes that share a mouse group and a shared visual range (I inject the shared visual range of type IRange in the constructor of the pane view model). I then set the XAxis visual range to the shared visual range inside each pane view model. However, when I use either of the below approaches outside of the pane view model to adjust the min and max of shared visual range, the Xaxis.VisualRange of each pane does not reflect that change.
Approach A: _sharedVisualRange.Min = ….; _sharedVisualRange.Max = …
Approach B: _sharedVisualRange.SetMinMax(….)
Neither approach actually impacts the XAxis.VisualRange.Min/Max.
Initially when I created the XAxis in code I set its VisualRange equal to the shared visual range that was injected via constructor, like :
XAxis = new CategoryDateTimeAxis()
{
……
……
VisualRange = _sharedVisualRange,
…..
};
Please note that all the above refers to code in the view model. I bind the XAxis in the pane view model to the XAxis of the surface in xaml.
My entire synchronization heavily relies on the assumption of this working, but it does not.
- bbmat asked 6 years ago
- last active 6 years ago
To whom this may concern:
I’d like to refer to the “Spline Scatter Line Chart” example in the SciChart Examples package. If I were to make this a CustomRenderableSeriesViewModel that I can set in a ViewModel class, how would I go about doing that?
I am using SciChart v4, and here’s what I know so far:
- CustomRenderableSeriesViewModel : BaseRenderableSeriesViewModel
- ViewType = typeof(CustomRenderableSeries)
My code so far is:
public class CustomRenderableSeriesViewModel : BaseRenderableSeriesViewModel
{
    public override Type ViewType => typeof(CustomRenderableSeries);
}
How would I go about setting the IsSplineEnabled property of the CustomRenderableSeries through the CustomRenderableSeriesViewModel class?
FYI: I have looked here and the Worked Example – CustomRenderableSeries in MVVM link goes to the SciChart v5 User manual.
Additionally, this is a duplicate of this issue on Stack Overflow (since I thought you were still fielding questions on there). Feel free to answer on either or both.
Can you please advise?
- Ari Sagiv asked 6 years ago
- last active 6 years ago
Hello,
I am trying to add a BoxAnnotation with MVVM pattern where the X-Axis is a DateTime axis. The annotation can be dragged into the X-direction. I need to know the DateTime of each position while dragging and also the final position(DateTime) of the BoxAnnotation when the drag Ended. I am listening to the DragDelta and DragEnded events in ViewModel. But here I couldn’t able to get the DateTime from X1 and X2 of that annotation model. I am sharing some snippets of my code. Can you please let me know how I can achieve this?
In xaml:
<Style x:Key="_boxAnnotationStyle" BasedOn="{StaticResource AnnotationBaseStyle}" TargetType="scichart:BoxAnnotation">
        <Setter Property="Template">
            <Setter.Value>
                <ControlTemplate TargetType="scichart:BoxAnnotation">
                    <Border x:Name="PART_BoxAnnotationRoot"
              Margin="{TemplateBinding Margin}"
              Background="{TemplateBinding Background}"
              BorderBrush="{TemplateBinding BorderBrush}"
              BorderThickness="{TemplateBinding BorderThickness}"
              CornerRadius="{TemplateBinding CornerRadius}" />
                </ControlTemplate>
            </Setter.Value>
        </Setter>
</Style>
<scichart:SciChartSurface x:Name="GraphSurface"
                 Annotations="{scichart:AnnotationsBinding ItsAnnotations}">

                <scichart:SciChartSurface.XAxis>
                    <scichart:DateTimeAxis x:Name="GraphXAxis"
                                           VisibleRange="{Binding ItsTimeVisibleRange, Mode=TwoWay}" />
                </scichart:SciChartSurface.XAxis>

                <scichart:SciChartSurface.YAxes>
                    <scichart:NumericAxis x:Name="GraphYAxis"
                                          VisibleRange="0, 10" />

                </scichart:SciChartSurface.YAxes>
 </scichart:SciChartSurface>
In ViewModel.cs
{
    private DateRange _timeVisibleRange;
    private ObservableCollection<IAnnotationViewModel> _annotations;
    private IAnnotationViewModel _boxAnnotation;
    public ObservableCollection<IAnnotationViewModel> ItsAnnotations
    {
        get
        {
            return _annotations;
        }
    }
    public DateRange ItsTimeVisibleRange
    {
        get { return _timeVisibleRange; }
        set
        {
            if (_timeVisibleRange == value) return;
            _timeVisibleRange = value;
            RaisePropertyChanged(() => ItsTimeVisibleRange);
        }
    }
    .
    .
    .
    _boxAnnotation = new BoxAnnotationViewModel()
        {
            IsEditable = true,
            DragDirections = SciChart.Charting.XyDirection.XDirection,
            X1 = DateTime.UtcNow.AddSeconds(300),
            X2 = DateTime.UtcNow,
            Y1 = 0,
            Y2 = 8,
            StyleKey = "_boxAnnotationStyle"
        };

     _annotations = new ObservableCollection<IAnnotationViewModel>() { };
     _annotations.Add(_boxAnnotation );

     _captureTimeRangeSelectorAnnotation.DragDelta += OnDrag;
     _captureTimeRangeSelectorAnnotation.DragEnded += DragEnded;
       .
       .
       .
    private void DragEnded(object sender, EventArgs e)
    {
         var boxAnnotationModel = sender as BoxAnnotationViewModel;
          // Need to know the DateTime value of X1 and X2
    }
    private void OnDrag(object sender, AnnotationDragDeltaEventArgs e)
    {
         var boxAnnotationModel = sender as BoxAnnotationViewModel;
         // Need to know the DateTime value of X1 and X2
    }
    .....
    .....
}
- Habibur Rahman asked 1 year ago
- last active 1 year ago
Hi,
Was hoping you could point me in the right direction. I’m trying to create horizontal line annotations on demand using MVVM but have become stuck. I’ve have them working in MVVM when the chart loads but not when a button is clicked although I have achieved this using code behind.
I’ve tried using an observable collection of AnnotationCollection type but am struggling to add the horizontal lines annotations to it as they are of a different type.
Any pointers in the right direction would be much appreciated!
Thanks,
Tim
Example of MVVM
TradeAnnotations = CreateHorizontalAnnotations();

private AnnotationCollection _annotations;

    public AnnotationCollection TradeAnnotations
    {
        get { return _annotations; }
        set
        {
            _annotations = value;
            OnPropertyChanged("TradeAnnotations");
        }
    }

    private static AnnotationCollection CreateHorizontalAnnotations()
    {
        //var annotations = new AnnotationCollection();

        var annotations = new AnnotationCollection();

        Color strokeColor = (Color)ColorConverter.ConvertFromString("#008B45");
        Brush strokeBrush = new SolidColorBrush(strokeColor);

        HorizontalLineAnnotation annotation = new HorizontalLineAnnotation();

        annotation.ShowLabel = true;
        annotation.LabelPlacement = LabelPlacement.Axis;
        annotation.HorizontalAlignment = HorizontalAlignment.Stretch;
        annotation.IsEditable = true;
        annotation.SnapsToDevicePixels = true;
        annotation.Stroke = strokeBrush;

        annotation.X1 = DateTime.Now;
        annotation.Y1 = 129;

        annotations.Add(annotation);

        return annotations;
    }
Example of code behind
        private void CreateHorizontalAnnotations(object sender, System.Windows.RoutedEventArgs e)
    {
        //var annotations = new AnnotationCollection();

        var annotationCollection = new AnnotationCollection();

        Color strokeColor = (Color)ColorConverter.ConvertFromString("#008B45");
        Brush strokeBrush = new SolidColorBrush(strokeColor);

        HorizontalLineAnnotation annotation = new HorizontalLineAnnotation();

        annotation.ShowLabel = true;
        annotation.LabelPlacement = LabelPlacement.Axis;
        annotation.HorizontalAlignment = HorizontalAlignment.Stretch;
        annotation.IsEditable = true;
        annotation.SnapsToDevicePixels = true;
        annotation.Stroke = strokeBrush;

        annotation.X1 = DateTime.Now;
        annotation.Y1 = 129;

        this.priceChart.Annotations.Add(annotation);
    }
- Tim Douglas asked 9 years ago
- last active 9 years ago
I’m trying to build a chart control that adheres to MVVM and noticed that I have the option to use NumericAxis or NumericAxisForMvvm, but I’m not sure exactly what the differences would be. I couldn’t really find anything in depth on them in the documentation but maybe I missed something.
Is anyone aware of any differences? I’m assuming NumericAxisForMvvm would be best for what I’m wanting but I’m not exactly sure why.
Thanks!
- Greg Knox asked 5 years ago
- last active 5 years ago
I’m trying to create a CustomRenderableSeries in MVVM. I’ve got my custom renderable series working fine outside of MVVM, and it seems pretty simple to wrap it with a ViewModel using the API.
However, the series isn’t displaying (Draw not getting called, and ranges not changing, so it’s not just failing to draw anything).
It’s pretty simple (and I’m going to add caching for the pens and brushes later):
public class CustomXyScatterRenderableSeriesViewModel : BaseRenderableSeriesViewModel
{
    // Tell SciChart what type of RenderableSeries you want to instantiate
    public override Type RenderSeriesType
    {
        get { return typeof(CustomXyScatterRenderableSeries); }
    }
}


public sealed class CustomXyScatterRenderableSeries : CustomRenderableSeries
{
    protected override void Draw(IRenderContext2D renderContext, IRenderPassData renderPassData)
    {
        XyzPointSeries pointSeries = renderPassData.PointSeries as XyzPointSeries;

        // PointMarkers are created once and cached
        var pointMarker = this.GetPointMarker();

        //if (pointMarker == null)
        //    return;

        int setCount = pointSeries.Count;

        IBrush2D brush = renderContext.CreateBrush(Brushes.Red, 0.5);
        IPen2D pen = renderContext.CreatePen(Colors.Transparent, false, 0, 0);
        // Iterate over points collection and render point markers
        for (int i = 0; i < setCount; i++)
        {
            double xPoint = (double)pointSeries.XValues[i];//pointSeries[i].X;
            double yPoint = (double)pointSeries.YValues[i];//pointSeries[i].Y;
            double zPoint = (int)pointSeries.ZPoints[i];

            // Get coordinates for X,Y data values
            var x1 = (int)renderPassData.XCoordinateCalculator.GetCoordinate(xPoint);
            var y1 = (int)renderPassData.YCoordinateCalculator.GetCoordinate(yPoint);
            var z1 = (int)zPoint+2;

            //var pointMarkerRect = new Rect(0, 0, pointMarker.PixelWidth, pointMarker.PixelWidth);
            //double xOffset = pointMarkerRect.Width / 2;
            //double yOffset = pointMarkerRect.Height / 2;

            // Draw PointMarkers
            renderContext.DrawEllipse(pen, brush, new Point(x1, y1), z1 * 2, z1 * 2); //(new Rect(x1 - xOffset, y1 - yOffset, pointMarkerRect.Width, pointMarkerRect.Height), pointMarker, pointMarkerRect);
        }
        brush.Dispose();
        pen.Dispose();
    }
}
When directly, all is good:
<s:SciChartSurface x:Name="SciChartSurface"
                   DebugWhyDoesntSciChartRender="True"
                   GridLinesPanelStyle="{StaticResource GridLinesPanelStyle}"
                   DataContext="{Binding ElementName=userControl}"

                   ViewportManager="{Binding ViewportManager}"
                   ChartTitle="{Binding Title}">

    <s:SciChartSurface.RenderSurface>
        <s3D:Direct3D10RenderSurface />
    </s:SciChartSurface.RenderSurface>

    <s:SciChartSurface.RenderableSeries>
        <helpers:CustomXyScatterRenderableSeries DataSeries="{Binding Data}"  />
    </s:SciChartSurface.RenderableSeries>

    <s:SciChartSurface.XAxis>
        <s:NumericAxis AxisTitle="{Binding XAxisLabel}" LabelProvider="{StaticResource SINumericLabelProvider}"/>
    </s:SciChartSurface.XAxis>
    <s:SciChartSurface.YAxis>
        <s:NumericAxis AxisTitle="{Binding YAxisLabel}" LabelProvider="{StaticResource SINumericLabelProvider}"/>
    </s:SciChartSurface.YAxis>
    <s:SciChartSurface.ChartModifier>
        <s:ModifierGroup>
            <s:MouseWheelZoomModifier x:Name="mouseWheelZoomModifier" />
            <s:RubberBandXyZoomModifier ExecuteOn="MouseRightButton" IsAnimated="True" />
            <s:ZoomPanModifier />
            <s:ZoomExtentsModifier ExecuteOn="MouseDoubleClick" />
        </s:ModifierGroup>
    </s:SciChartSurface.ChartModifier>
</s:SciChartSurface>
But when using the View Model, it fails to display:
<s:SciChartSurface x:Name="SciChartSurface"
                   DebugWhyDoesntSciChartRender="True"
                   GridLinesPanelStyle="{StaticResource GridLinesPanelStyle}"
                   DataContext="{Binding ElementName=userControl}"

                   ViewportManager="{Binding ViewportManager}"
                   ChartTitle="{Binding Title}"
                   RenderableSeries="{s:SeriesBinding Series}">

    <s:SciChartSurface.RenderSurface>
        <s3D:Direct3D10RenderSurface />
    </s:SciChartSurface.RenderSurface>

    ....
</s:SciChartSurface>
I’m not sure what I’m doing wrong, as there doesn’t seem to be much more to it!
Edit: More info, in the code behind, I’m binding to this data for testing:
    public XyzDataSeries<float, float, int> Data { get; set; }
    public ObservableCollection<IRenderableSeriesViewModel> Series { get; set; }

    public LineChart()
    {
        this.DataContext = this;
        Data = new XyzDataSeries<float, float, int>();
        Data.Append(50, 50, 10);
        Data.Append(100, 100, 15);
        Series = new ObservableCollection<IRenderableSeriesViewModel>();
        Series.Add(new CustomXyScatterRenderableSeriesViewModel() { DataSeries = Data });

        InitializeComponent();
    }
- Ken Hobbs asked 8 years ago
- last active 8 years ago
I saw in tips and tricks for performance the use of
scichartsurface.suspendupdate
before something is added to the dataseries. But usually I don’t have access in ViewModel to surface. How can I suspendupdate in the ViewModel when updating the series?
Is dataseries.SuspendUpdate used for this?
- Uwe Hafner asked 9 years ago
- last active 9 years ago
Hello,
I’m trying to display a vertical line annotation on a chart using MVVM.
In order to make it work I’ve (All the INotifyPropertyChanged are managed via the BaseViewModel)
public class GraphSurfaceBaseViewModel : BaseViewModel
{
    /// <summary>
    /// A list of annotations
    /// </summary>
    public ObservableCollection<IAnnotationViewModel> Annotations { get; private set; }

 ...
}
I create annotation that way
Graph.Annotations.Add(new VerticalLineAnnotationViewModel()
            {
                X1 = TimeOfComment,
                ShowLabel = true,
                StrokeThickness = 2,
                XAxisId = "Xaxis",
                YAxisId = "Yaxis1",
                AnnotationLabels = new ObservableCollection<AnnotationLabel>() { new AnnotationLabel() {Text = "mon test", LabelPlacement = LabelPlacement.TopRight } }

            });
And the binding to the scichartsurface is :
<s:SciChartSurface
...
Annotations="{s:AnnotationsBinding Annotations}"
</s:SciChartSurface>
I’ve double check that my x axis and y axis have the same ID as the annotation.
The problem is I want to display several annotation labels but they are not appearing. I suspect a problem via the AnnotationsBinding which is not taking the AnnotationLabels from the VerticalLineAnnotationViewModel.
What I got :

What I want (paint skill here):

For the what I want, I can draw a simple vertical bar by settings showLabel = false but I suppose that all the label I previously added to the
AnnotationLabels will not be shown, that’s why I let it.
Thank you for any help.
Renaud
- Renaud Danniau asked 5 years ago
- last active 5 years ago
Hi there,
I am relatively new to C# and scicharts so you will have to forgive me a little.
In the project I am working on, I am trying to add dynamic renderable series as the user selects items in a tree. I have looked through the online tutorials and forums but still am having trouble. I am creating my own renderable series view model class derived off of LineRenderableSeriesViewModel. I found documentation that I needed to override the ViewType property and set it to a FastLineRenderableSeriesForMvvm.
When I am creating these objects to add to the ObservableCollection which is bound to my scichart surface, I can set the PointMarker and its properties, but not the SelectedPointMarker properties.
XAML:
    <s:SciChartSurface Style="{StaticResource BasicSciChartSurfaceStyleRateVsTime}"
                       ViewportManager="{Binding RateVsTimePlot.Manipulator.Viewport}"
                       Name="RateVsTime" x:FieldModifier="private"
                       ZoomHistoryManager="{Binding RateVsTimePlot.ZoomHistory}"
                       PreviewMouseLeftButtonDown="PreviewRateVsTimeMouseLeftButtonDown"
                       PreviewMouseLeftButtonUp="PreviewRateVsTimeMouseLeftButtonUp"
                       RenderableSeries="{s:SeriesBinding RateVsTimePlot.RenderableSeriesViewModels}"
                       local:YAxesCollectionBehaviour.AxisSource="{Binding RateVsTimePlot.YAxesViewModels}"
                       local:YAxesCollectionBehaviour.AxisStyle="{StaticResource AxisStyle}"/>
Style:
<Style x:Key="ProdLineStyle" TargetType="s:FastLineRenderableSeriesForMvvm">
    <Setter Property="s:TooltipModifier.IncludeSeries" Value="False"/>
    <Setter Property="SelectedPointMarker">
        <Setter.Value>
            <s:EllipsePointMarker Fill="{Binding SeriesColors.ProductionColor}"
                                  Stroke="{Binding SeriesColors.ProductionColor}"
                                  Width="6" Height="6">
            </s:EllipsePointMarker>
        </Setter.Value>
     </Setter>
</Style>
ViewModel :
        var renderableSeries = new GenericRenderableSeriesViewModel
        {
            DataSeries = dataSeries.DataSeries,
            YAxisId = dataSeries.AxisId,
            IsSelected = IsSelected,
            SeriesColors = _dataColors[fluidRateType],
            DisplayEnabled = AnalysisInteractionMode.IsLineManipulationDisabled,
            PointMarker = new EllipsePointMarker(),
            StyleKey = "ProdLineStyle"
        };

        renderableSeries.SetRenderableSeriesColorSettings();

        renderableSeries.DataSeries.SeriesName = fluidRateType.ToString();
        return renderableSeries;

public void SetRenderableSeriesColorSettings()
    {
        Stroke = SeriesColors.ProductionColor;

        if (PointMarker == null) return;

        PointMarker.Stroke = SeriesColors.ProductionColor;
        PointMarker.Fill = SeriesColors.ProductionColor;
        PointMarker.Height = PointNonSelectedHeight;
        PointMarker.Width = PointNonSelectedWidth;
    }
When I run my app, I see what I am expecting by default, but when I do a point selection rectangle, the behavior is not correct. I only see the line. The points with in the rectangle disappear.
I am trying to move away from having the style set the selectedPointMarker, and doing it through code in the view model just like the function above as users will be able to change these properties in the future. But so far I haven’t found a way to do either.
Am I using the correct classes, or do I need to override something else? Any ideas or suggestions would be greatly appreciated
Thanks
Rylan
- Rylan Herndier asked 7 years ago
- last active 7 years ago
Hi SciChart team,
I have built a xyscatter chart with DateTime type X-Axis and Double type Y-Axis,
and built boxannotations to mark areas.
May I set the x-Axis value in the tooltip?
Or can I show properties of each item which means every point in the xyscatterseries, and customize the tooltip content style like adding the description of every properties.
- Wade Yao asked 3 years ago
- last active 3 years ago
Hello, SciChart Team!
i have an issue using mouse drag event ( RubberBandXyZoomModifier, ZoomPanMidifier). the message says “NullReferenceException in SciChart.Charting.dll ” or “Thread.cs not found” from time to time.
after some experiments i figured out that the app starts to crush after i change XAxis type .
i have a simple mvvm user control used to display both arrays of double and datebound data, XAxes of SciChart Surfase is bound to an observable collection of IAxis elements. if i need to change chart type i clear this collection and create an axis of desired type (DateTimeAxisViewModel or NumericAxisViewModel). after that the series can be added, but zooming causes crash with nearly to no info.
i attached a solution, which lacks only scichart dlls in order to run (hopefully), Window_Loaded method has a commented line which changes chart type and makes app crush on zooming, would be nice if you checked it out.
Thanks in advance!
Alexander
- Alexander Volkov asked 6 years ago
- last active 6 years ago
I would like to template items of an AxisCollection assigned to a sciChartSurface in binding of an AxisItemCollectionViewModel. But it looks like I cannot do it as Visual Studio won’t compile my tries.
What i am looking for is something like the EEG 16 channel sample. There the ListBoxItems are styled via a template which is bound to a ViewModelItem. The ListBox itsself is bound to a ViewModelCollection. Depending on how many entries there are entries in the listbox.
So I would like to do something like this:
<SciChartSurface.AxisCollection ItemsSource="{Binding MyAxisCollectionViewModels}" ItemTemplate="{StaticResource AxisItemTemplate}" />
Is this possible? I don’t know how many y-axes i will have. They are configurable by the user.
- Uwe Hafner asked 9 years ago
- last active 9 years ago
Hi,
I am developing an MVVM WPF application and need to access the SelectedPointMarkers property of DataPointSelectionModifier from the ViewModel.
From looking at the DataPointSelectionModifier documentation (https://www.scichart.com/documentation/win/current/webframe.html#DataPoint%20Selection.html) I can see how you can get the X and Y coordinate values of a selected point in a view, by binding the PointMarkersSelectionModifier to a listbox.
However this doesn’t really help me, I need to get the coordinates of the SelectedPointMarker into a property inside the ViewModel that can be accessed, rather than just binding to a listbox in the view itself.
I’ve also looked at this similar post: (https://www.scichart.com/questions/wpf/i-want-to-bind-selectedpointmarkers-of-datapointselectionmodifier), but I had no luck getting Kenishis solution to work in my case.
How can i do this?
Thanks.
- Sean Connell asked 3 years ago
- last active 2 years ago
