Hi !
Is it possible to display the RollOverModifier tooltip on the real points only ? Say I have points (1 1) and (3 3) in my chart and I don’t wan’t the tooltip to display (1.5 1.5), (2 2), (2.5 2.5) etc. when rolling over… Any idea ?
Thank you,
Adrien
- Adrien De Coninck asked 7 years ago
- last active 7 years ago
Hello,
I’m wanting to switch to SciChart from a previous charting library. One neat thing that our previous library did that I cannot figure out how to do in SciChart is change the interaction between tooltips/rollover and panning.
What I would like to do is Pan/Drag the chart on short tap events, and do a rollover or tooltip cursor on long tap events. By default it looks like I get rollover and panning together on any tap event, which is not ideal behavior for my apps. Depending on the tap event type, I would like to do just one or the other, not both. How can I do something similar with SciChart?
Thank you,
- C Bolton asked 4 years ago
- last active 4 years ago
Hello,
When annotations and the rollover modifiers are displayed on the very left side of a chart they align with the center of the candlesticks on the chart. However, as they get displayed toward the right side of the chart they get more and more offset to the right side of the candlestick.
Can anyone point me in the right direction to figure out how to fix this issue seemingly with my xAxis?
See attached screenshots,
- Leland asked 10 months ago
- last active 10 months ago
Hello, I am using SciChartJS and have a new requirement from our users as follows that I need help with the implementation. Any pointers from anyone would be a great help.
**Requirements: **
- Assume that x-axis is Time and y-axis is prices.
- There are multiple series in the chart (e.g., Bid Price, Ask Price)
- Allow user to select a time on xAxis using
CTRL + CLICK - When the user selects the time, show the rollover line and the tooltip for all series at the selected time
- This rollover line and tooltip should remain visible until the user selects a new time on the x-axis at which point the rollover tooltip should display the tooltip for the new point.
I started inheriting the RolloverModifier but couldn’t find an appropriate method to show the tooltip.
So, I started implementing the above feature using CustomModifierBase2d and adding a VerticalLineAnnotation for the rollover line. But again, struggling with the tooltip.
If someone could help me out or give me pointers, that would be highly appreciated.
Best Regards,
Sachin Patel.
- sachin patel asked 9 months ago
- last active 8 months ago
In my implementation I have the xAxis using a DateAxis in the dataset I am using there is only one data point.
The RolloverModifier is very sensitive it is very hard to highlight that one point.
RolloverModifier rolloverModifier = new VitalChartRolloverModifier();
rolloverModifier.setSourceMode(SourceMode.AllVisibleSeries);
rolloverModifier.setDrawVerticalLine(true);
rolloverModifier.setShowTooltip(true);
rolloverModifier.setShowAxisLabels(false);
rolloverModifier.setIsEnabled(true);
rolloverModifier.setUseInterpolation(false);
Is there a way of making it less sensitive?
- Simon Barnes asked 6 years ago
- last active 6 years ago
Imagine I have a chart with a RolloverModifier, such that I see the point marker, and also a CursorModifier so I see the axis labels with the exact value I’m hovering.
This chart has the axis title hidden, and also the labels hidden, so I can really only see them trough the CursorModifier axis labels.
Since the axis title and labels are hidden, the axis labels spawn inside the chart, and the point marker from the RolloverModifier may be drawn on top of the labels.
I’d like to properly control drawing order here, so my axis labels get prioritised.
Is there a way to do so?
Codepen example: https://codepen.io/jrfv/full/VwqVBdo
- João Velasques asked 6 months ago
- last active 3 months ago
Hi,
I’m trying to update a chart from version 3.1.x of a chart. In the old chart there was a XyScatterRenderableSeries with markers width set to 8. The Rollover line had the same width as the marker and it was easy to hit a point. After update the rollover line is thin and it is hard to hit a point. Please advise if it is possible to get back the old behavior.
- Andreas Wanke asked 7 years ago
- last active 7 years ago
Hi,
I’m using RolloverModifier and i want to show only point marker. I don’t want to show tooltip or any info on series. Is it possible?
Tnx.
- Dunya Biralem asked 4 years ago
- last active 4 years ago
I have two questions on rollover modifier.
One is the tooltip of the rollover is right under the finger on a heatmap chart. Can I move it to the top left section of the touch point?
Second question is how can I implement a callback function whenever Y axis of the rollover modifier changes?
Thanks for your attention in advance.
- Gang Xu asked 4 years ago
- last active 4 years ago
After migrating to 4.0.5, I have shadows on my tooltips as below.
Also, the herringbone pattern is new to 4.0.
I have:
  </Border>
</ControlTemplate>


<s:SciChartSurface.ChartModifier>
    <s:ModifierGroup>
      <s:RolloverModifier s:Name="rolloverModifier"
                                    LineOverlayStyle="{StaticResource RolloverLineStyle}"
                                    DrawVerticalLine="True"
                                    SourceMode="AllSeries"
                                    ShowTooltipOn="MouseLeftButtonDown"
                                    ShowAxisLabels="True" />
      <s:SeriesSelectionModifier ReceiveHandledEvents="True" />
    </s:ModifierGroup>
  </s:SciChartSurface.ChartModifier>
Any hints on how to get rid of them?
- Robert Zeff asked 8 years ago
- last active 8 years ago
Hello,
Is there an event that is triggered by the rollover modifier, or some other modifier for that matter?
Basically, I am trying to get the X/Y values of the point that the mouse is currently over through code.
Any help is appreciated.
- Aaron Douglas asked 9 years ago
- last active 9 years ago
Hello !
I have a chart displaying very accurate data and I would like the RolloverModifier to adopt the same format as my Y axis.
I want to avoid problems similar to the one on the screenshot attached. The tooltip is indicating -0 and I would like it to display something like -2.5E-6.
Thank you for your help,
Adrien
- Adrien De Coninck asked 7 years ago
- last active 7 years ago
I’m getting the following crash:
2020-02-14 16:45:43.902812-0500 CommonStock Development[2425:710225] -[SCIRolloverModifier onTouchesCancelled:]: unrecognized selector sent to instance 0x282ffe080
2020-02-14 16:45:43.904098-0500 CommonStock Development[2425:710225] *** Terminating app due to uncaught exception ‘NSInvalidArgumentException’, reason: ‘-[SCIRolloverModifier onTouchesCancelled:]: unrecognized selector sent to instance 0x282ffe080’
whenever I try to scrub my chart, I must also note that in order for the legend to show, I have to tap really hard on the surface.
This is my code:
func set(data set: SimpleChartDataSet, alternate: SimpleChartDataSet) {

    let lineDataSeries = SCIXyDataSeries(xType: .double, yType: .double)
    let dashedDataSeries = SCIXyDataSeries(xType: .double, yType: .double)

    let group = DispatchGroup()
    group.enter()

    DispatchQueue.global(qos: .userInteractive).async {
        for (index, i) in set.enumerated() {
            lineDataSeries.append(x: Double(index), y: Double(i))
        }

        for (index, i) in alternate.enumerated() {
            dashedDataSeries.append(x: Double(index), y: Double(i))
        }

        group.leave()
    }

    group.notify(queue: .main) {

        let lineSeries = SCIFastMountainRenderableSeries()
        lineSeries.zeroLineY = set.min() ?? 0.0
        lineSeries.dataSeries = lineDataSeries
        lineSeries.strokeStyle = SCISolidPenStyle(color: UIColor.green, thickness: 2.0)
        lineSeries.areaStyle =  SCILinearGradientBrushStyle(start: CGPoint(x: 0, y: 1), end: CGPoint(x: 0, y: 0), start: UIColor.green, end: UIColor.clear)

        let dashedSeries = SCIFastLineRenderableSeries()
        dashedSeries.zeroLineY = set.min() ?? 0.0
        dashedSeries.dataSeries = dashedDataSeries
        dashedSeries.strokeStyle = SCISolidPenStyle(color: UIColor.white, thickness: 2.0, strokeDashArray: [2.0,2.0,2.0,2.0])

        SCIUpdateSuspender.usingWith(self.surface) {

            self.surface.xAxes.clear()
            self.surface.yAxes.clear()
            self.surface.renderableSeries.clear()

            let xAxis = SCINumericAxis()
            xAxis.drawLabels = false
            xAxis.drawMajorBands = false
            xAxis.drawMajorGridLines = false
            xAxis.drawMinorGridLines = false
            xAxis.drawMinorTicks = false
            xAxis.drawMajorTicks = false
            xAxis.drawLabels = false

            let yAxis = SCINumericAxis()
            yAxis.drawLabels = false
            yAxis.drawMajorBands = false
            yAxis.drawMajorGridLines = false
            yAxis.drawMinorGridLines = false
            yAxis.drawMinorTicks = false
            yAxis.drawMajorTicks = false
            yAxis.drawLabels = false

            self.surface.xAxes.add(items: xAxis)
            self.surface.yAxes.add(items: yAxis)
            self.surface.renderableSeries.add(items: lineSeries, dashedSeries )
            self.surface.chartModifiers.add(SCIRolloverModifier())
        }
    }
}
- jose solorzano asked 4 years ago
- last active 4 years ago
Hello
My application environment is on the mobile browser, so we need to switch between [pan] and [rollover]
When I use a button to switch, everything is fine, but when I want to switch with a long press, an exception occurs
Below is my code
    initModifier() {
        this.partitionList.forEach((obj, idx)=>{
            let sciChartSurface = this.sciObj[idx].sciChartSurface;
            this.zoomPanModifier[idx] = new ZoomPanModifier();
            this.rolloverModifier[idx] = new RolloverModifier({modifierGroup: this.modifierGroupId, showTooltip: false});
            this.zoomPanModifier[idx].isEnabled = true;
            // 擴增功能
            sciChartSurface.chartModifiers.add(
                this.zoomPanModifier[idx],
                new ZoomExtentsModifier(),
                new MouseWheelZoomModifier(),
                new PinchZoomModifier(),
            );
        });
    },
    switchCross() {
        let enablePan = !this.zoomPanModifier[0].isEnabled;
        this.partitionList.forEach((obj, idx)=>{
            let sciChartSurface = this.sciObj[idx].sciChartSurface;
            this.zoomPanModifier[idx].isEnabled = enablePan;
            if (enablePan)
                sciChartSurface.chartModifiers.removeAt(4);
            else
                sciChartSurface.chartModifiers.add(this.rolloverModifier[idx]);
        });
    },
I recorded a video, first use the button to switch, and then long press to switch, you can see the problem I want to narrate from the video, the URL is as follows: https://youtu.be/vJjbLNGS-iM
After the problem occurred, it was expected that touchmove should be [pan], but it became [zoom]
Thanks for your help
- chinghung lai asked 2 years ago
- last active 2 years ago
Hello SciChart Team,
I was facing a problem lately and would like to know if you can reproduce it or maybe if you have fixed it in the latest version already.
I have created a chart with a X axis using DateTime as format. When I use the RolloverModifier in combination with Interpolation I get an ArgumentOutOfRangeException when moving the cursor to the Y Axis (see attached image).
I have attached the full excetption details as well.
I am looking forward to your feedback.
Thanks and best regards
Stefan
SciChart Version: 5.4.0.12119
SciChart Runtime Version: v4.0.30319


System.ArgumentOutOfRangeException was unhandled Message: An unhandled
exception of type 'System.ArgumentOutOfRangeException' occurred in
WindowsBase.dll Additional information: Ticks must be between
DateTime.MinValue.Ticks and DateTime.MaxValue.Ticks.


System.ArgumentOutOfRangeException: Ticks must be between DateTime.MinValue.Ticks and DateTime.MaxValue.Ticks.
Parameter name: ticks
   at System.DateTime..ctor(Int64 ticks)
   at A.ARB.Subtract(DateTime a, DateTime b)
   at SciChart.Charting.Model.DataSeries.DataSeries2.FindClosestLine(IComparable x, IComparable y, Double xyScaleRatio, Double xRadius, LineDrawMode drawNanAs)
   at SciChart.Charting.Visuals.RenderableSeries.BaseRenderableSeries.NearestHitResult(Point mouseRawPoint, Double hitTestRadiusInPixels, SearchMode searchMode, Boolean considerYCoordinateForDistanceCalculation)
   at SciChart.Charting.Visuals.RenderableSeries.BaseRenderableSeries.HitTestInternal(Point rawPoint, Double hitTestRadius, Boolean interpolate)
   at SciChart.Charting.Visuals.RenderableSeries.BaseRenderableSeries.HitTest(Point rawPoint, Double hitTestRadius, Boolean interpolate)
   at SciChart.Charting.Visuals.RenderableSeries.BaseRenderableSeries.VerticalSliceHitTest(Point rawPoint, Boolean interpolate)
   at SciChart.Charting.ChartModifiers.RolloverModifier.GWB(Point D)
   at SciChart.Charting.ChartModifiers.RolloverModifier.BY.MoveNext()
   at SciChart.Charting.Common.Extensions.EnumerableExtensions.RU.MoveNext()
   at SciChart.Core.Extensions.EnumerableExtensions.ForEachDo[T](IEnumerable1 enumerable, Action1 operation)
   at SciChart.Charting.ChartModifiers.RolloverModifier.FillWithIncludedSeries(IEnumerable1 infos, ObservableCollection1 seriesInfos)
   at SciChart.Charting.ChartModifiers.RolloverModifier.HandleMasterMouseEvent(Point mousePoint)
   at SciChart.Charting.ChartModifiers.InspectSeriesModifierBase.TUB(Point D)
   at SciChart.Charting.ChartModifiers.InspectSeriesModifierBase.HandleMouseEvent(ModifierMouseArgs e)
   at SciChart.Charting.ChartModifiers.InspectSeriesModifierBase.OnModifierMouseMove(ModifierMouseArgs e)
   at SciChart.Charting.ChartModifiers.ModifierGroup.<>c.OB(IChartModifier D, ModifierEventArgsBase I)
   at SciChart.Charting.ChartModifiers.ModifierGroup.FTB(Action2 D, ModifierEventArgsBase I)
   at SciChart.Charting.ChartModifiers.ModifierGroup.OnModifierMouseMove(ModifierMouseArgs e)
   at SciChart.Core.Utility.Mouse.MouseManager.UB(ModifierMouseArgs D, IReceiveMouseEvents I, Boolean J)
   at SciChart.Core.Utility.Mouse.MouseManager.ZDB.M(IReceiveMouseEvents D)
   at SciChart.Core.Extensions.EnumerableExtensions.ForEachDo[T](IEnumerable1 enumerable, Action1 operation)
   at SciChart.Core.Utility.Mouse.MouseManager.JB(IReceiveMouseEvents D, ModifierMouseArgs I, Action3 J)
   at SciChart.Core.Utility.Mouse.MouseManager.GB(IPublishMouseEvents D, IReceiveMouseEvents I, MouseEventArgs J, MouseButtons M, Action3 O)
   at SciChart.Core.Utility.Mouse.MouseManager.AEB.T(Object D, MouseEventArgs I)
   at A.LEB.S(MouseEventArgs D)
   at A.LEB.M(Object D, MouseEventArgs I)
   at System.Windows.Input.MouseEventArgs.InvokeEventHandler(Delegate genericHandler, Object genericTarget)
   at System.Windows.RoutedEventArgs.InvokeHandler(Delegate handler, Object target)
   at System.Windows.RoutedEventHandlerInfo.InvokeHandler(Object target, RoutedEventArgs routedEventArgs)
   at System.Windows.EventRoute.InvokeHandlersImpl(Object source, RoutedEventArgs args, Boolean reRaised)
   at System.Windows.UIElement.RaiseEventImpl(DependencyObject sender, RoutedEventArgs args)
   at System.Windows.UIElement.RaiseTrustedEvent(RoutedEventArgs args)
   at System.Windows.UIElement.RaiseEvent(RoutedEventArgs args, Boolean trusted)
   at System.Windows.Input.InputManager.ProcessStagingArea()
   at System.Windows.Input.InputManager.ProcessInput(InputEventArgs input)
   at System.Windows.Input.InputProviderSite.ReportInput(InputReport inputReport)
   at System.Windows.Interop.HwndMouseInputProvider.ReportInput(IntPtr hwnd, InputMode mode, Int32 timestamp, RawMouseActions actions, Int32 x, Int32 y, Int32 wheel)
   at System.Windows.Interop.HwndMouseInputProvider.FilterMessage(IntPtr hwnd, WindowMessage msg, IntPtr wParam, IntPtr lParam, Boolean& handled)
   at System.Windows.Interop.HwndSource.InputFilterMessage(IntPtr hwnd, Int32 msg, IntPtr wParam, IntPtr lParam, Boolean& handled)
   at MS.Win32.HwndWrapper.WndProc(IntPtr hwnd, Int32 msg, IntPtr wParam, IntPtr lParam, Boolean& handled)
   at MS.Win32.HwndSubclass.DispatcherCallbackOperation(Object o)
   at System.Windows.Threading.ExceptionWrapper.InternalRealCall(Delegate callback, Object args, Int32 numArgs)
   at System.Windows.Threading.ExceptionWrapper.TryCatchWhen(Object source, Delegate callback, Object args, Int32 numArgs, Delegate catchHandler)
   at System.Windows.Threading.Dispatcher.LegacyInvokeImpl(DispatcherPriority priority, TimeSpan timeout, Delegate method, Object args, Int32 numArgs)
   at MS.Win32.HwndSubclass.SubclassWndProc(IntPtr hwnd, Int32 msg, IntPtr wParam, IntPtr lParam)
   at MS.Win32.UnsafeNativeMethods.DispatchMessage(MSG& msg)
   at System.Windows.Threading.Dispatcher.PushFrameImpl(DispatcherFrame frame)
   at System.Windows.Threading.Dispatcher.PushFrame(DispatcherFrame frame)
   at System.Windows.Application.RunDispatcher(Object ignore)
   at System.Windows.Application.RunInternal(Window window)
   at System.Windows.Application.Run(Window window)
   at System.Windows.Application.Run()
   at XXX.App.Main()
   at System.AppDomain._nExecuteAssembly(RuntimeAssembly assembly, String[] args)
   at System.AppDomain.ExecuteAssembly(String assemblyFile, Evidence assemblySecurity, String[] args)
   at Microsoft.VisualStudio.HostingProcess.HostProc.RunUsersAssembly()
   at System.Threading.ThreadHelper.ThreadStart_Context(Object state)
   at System.Threading.ExecutionContext.RunInternal(ExecutionContext executionContext, ContextCallback callback, Object state, Boolean preserveSyncCtx)
   at System.Threading.ExecutionContext.Run(ExecutionContext executionContext, ContextCallback callback, Object state, Boolean preserveSyncCtx)
   at System.Threading.ExecutionContext.Run(ExecutionContext executionContext, ContextCallback callback, Object state)
   at System.Threading.ThreadHelper.ThreadStart()
- Stefan Ott asked 4 years ago
- last active 4 years ago
I have an impulse series chart, and with SciChart v3.x the rollover modifier line would “snap” to the nearest point. Since migrating to v6.5 this no longer happens – only the rollover marker snaps, not the vertical line. Setting UseInterpolation=”False” has no effect.
I’ve only noticed this on the impulse series, and the rollover line does still snap on other types (e.g. line, scatter). I just wanted to check that I’m not missing something, or if there any way to reinstate this snapping behaviour?
- Andrew Stephens asked 2 years ago
- last active 2 years ago
Using custom label provider I am able to format the cursor label, but still there is the name of the axis. I only want to show the value here, like “0,91” and remove the “X:” (see attached screenshots).
Thanks in advance.
override func formatCursorLabel(_ dataValue: SCIGenericType) -> String! {
    return "" // super.formatCursorLabel(dataValue)
}
- Christoph Rehbichler asked 6 years ago
- last active 6 years ago
In our app we have a feature by which user can add indicators. These indicators can consist of 2 or a maximum of 4 lines.
We don’t want to render svg tooltips(which setted up by the default) with data for each line, instead of that we get point data and pass it to our app inner service that can render indicator legend.
To prevent default tooltips from being displayed we set for each renderable series of an indicator the following values.
rolloverModifierProps.width = 0; rolloverModifierProps.height = 0;
But of course tooltips are still rendered in the DOM and this leads to performance issues when we have 3 or more indicators of this type.
My question is the following
How we can render only circles svg for rollover modifier and completely dont render svg for tooltips in the DOM?
This is what the indicators look like
- Sergey Chernyakov asked 8 months ago
- last active 7 months ago
Hello,
I would like to use the RolloverModifier to display a given datapoint’s identification (string) metadata. The solution suggested in this link on correlating metadata to datapoints seems promising, but for the fact that I have multiple charts to display simultaneously, hence I need multiple lookup arrays. I originally thought to use a ValueConverter that would manage lookup of the identification value based a chart view model instance code (ChartId) and the index provided in the XyzDataSeries. As control charts are instantiated, they register with the ValueConverter, which maintains a static lookup dictionary. In the XAML, the ZValue is passed as the value and the chartID is passed as a parameter to the ValueConverter. I have run into a couple key challenges, however:
- ConverterParameters cannot be bound; hence I cannot bind to the ChartId, whether it is stored in a viewmodel or in a different XAML element.
- WPF does not allow use of nested value converters in XAML; this prevents me from nesting the ValueConverter within the chart view model (where reference to the ChartId is readily available).
I’m exploring some other options, but they are getting ugly fast, so I figured it’s time to ask for assistance. Is there another way to do this (desirably adhering to MVVM practices)?
Key excerpts of my code are pasted below:
Surface:
<TextBlock x:Name="ChartIdBlock" IsEnabled="False" Text="{Binding ChartId}"/>
<s:SciChartSurface x:Name="ScsControlChart" MinHeight="200" s:ThemeManager.Theme="BlackSteel">
<s:SciChartSurface.RenderableSeries>
    <s:FastLineRenderableSeries x:Name="Data" SeriesColor="White" DataSeries="{Binding Chart, Converter={StaticResource ChartDataToDataSeriesConverter}}" IsSelected="True"/>
   <!-- More data series in same chart -->
</s:SciChartSurface.RenderableSeries>
<s:SciChartSurface.XAxis>
    <s:DateTimeAxis  VisibleRange="{Binding XRange, UpdateSourceTrigger=PropertyChanged, Mode=TwoWay}" TickLabelStyle="{StaticResource AxisLabelStyle}" />
</s:SciChartSurface.XAxis>
<s:SciChartSurface.YAxis>
    <s:NumericAxis DrawMajorBands="True" VisibleRange="{Binding YRange, UpdateSourceTrigger=PropertyChanged, Mode=TwoWay}" TickLabelStyle="{StaticResource AxisLabelStyle}"/>
</s:SciChartSurface.YAxis>
<s:SciChartSurface.ChartModifier>
    <s:ModifierGroup>
        <s:RolloverModifier x:Name="RolloverModifier" DrawVerticalLine="True" SourceMode="SelectedSeries" TooltipLabelTemplate="{StaticResource RolloverLabelTemplate}"/>
    </s:ModifierGroup>
</s:SciChartSurface.ChartModifier>
RolloverLabelTemplate:
<ControlTemplate x:Key="RolloverLabelTemplate" TargetType="s:TemplatableControl">
    <Border Grid.Row="1" HorizontalAlignment="Left" VerticalAlignment="Top" Background="#77FFFFFF" BorderBrush="#55000000" BorderThickness="1" Padding="5">
        <ItemsControl ItemsSource="{Binding ElementName=RolloverModifier, Path=SeriesData.SeriesInfo}">
            <ItemsControl.ItemTemplate>
                <DataTemplate>
                        <StackPanel Grid.Column="2" Orientation="Horizontal" Margin="3,3,20,3">
                            <TextBlock FontSize="13" FontWeight="Bold" Foreground="{Binding SeriesColor, Converter={StaticResource ColorToBrushConverter}}"
                                       Text="{Binding ZValue, Converter={StaticResource IndexToIdConverter}, ConverterParameter={Binding ElementName=ChartIdBlock, Path=Text}}"/>
                        </StackPanel>
                </DataTemplate>
            </ItemsControl.ItemTemplate>
        </ItemsControl>
    </Border>
Value Converter:
public sealed class ChartIndexToIdConverter : IValueConverter
{
    private readonly static Dictionary<int, Tuple<int, string[]>> _lookup = new Dictionary<int, Tuple<int, string[]>>();
    private readonly static Random _rnd = new Random();

    public static int Register(IControlChart chart)
    {
        var key = _rnd.Next();
        while (_lookup.ContainsKey(key)) key = _rnd.Next();
        _lookup.Add(key, new Tuple<int, string[]>(chart.First().Index, chart.Select(d => d.Id).ToArray()));
        return key;
    }

    public object Convert(object value, Type targetType, object parameter, CultureInfo culture)
    {
        if (value == null) throw new ArgumentNullException("value");
        if (parameter == null) throw new ArgumentNullException("parameter");
        var tuple = _lookup[(int)parameter];
        return tuple.Item2[(int)value - tuple.Item1];
    }
}
- Thomas Kriewall asked 9 years ago
- last active 8 years ago
Hi,
NOTE: Still using Scichart 1.7 here…
I have two questions about the rollovermodifier behaviour:
-
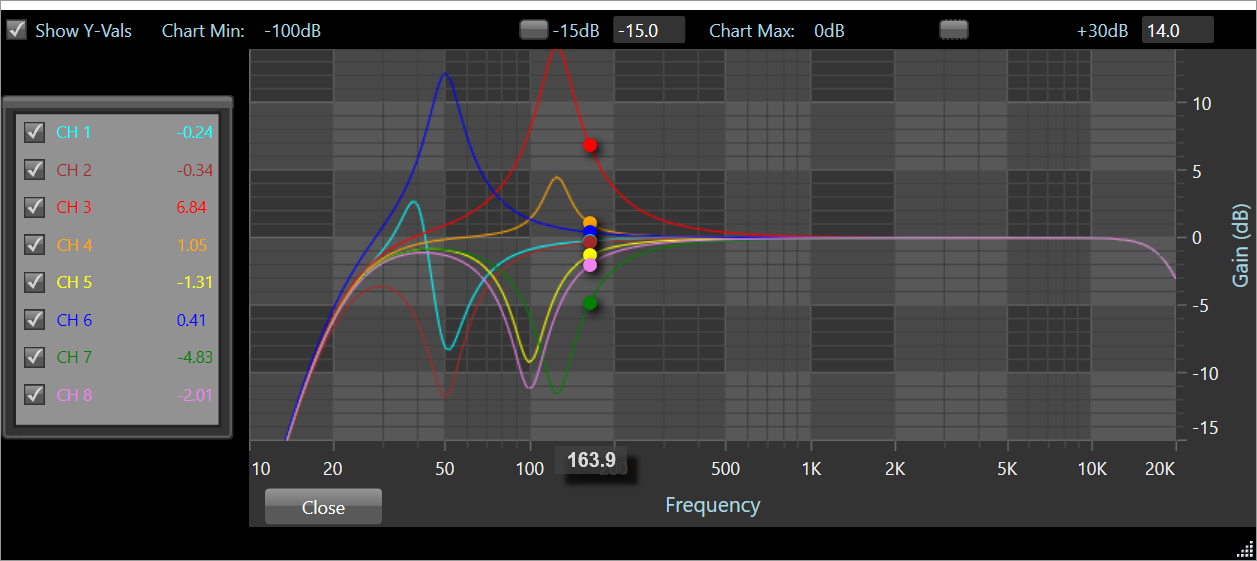
As you can see in the picture, when rolling over the chart, sometimes the Xvalues of the series are not aligned. Is it possible to force this to be the same? Basically i always want the Xvalue to be the same for all the series when rolling over, would be nice to have the xvalue where the vertical bar is shown…
-
Might be just the chart behaviour, but is it possible to have the rollover feedback performed for values not in the visible range? When zoomed in, and for instance the top of the columnBar is not within the range, the seriesinfo is not shown for this datapoint.
Thanks a lot for the feedback.
- Robert Post asked 9 years ago
- last active 9 years ago
It seems most of the modifiers bring up tooltip data with a pan, and then it goes away when the user lifts their finger. Is there any way to bring up tooltip data with a tap (and does not go away when the finger has lifted)? The main problem that we’re trying to solve is that we would like to be able to pan to look at the chart (and don’t want an axis pan), but would also like to bring up tooltip data.
- Bharathi vadde asked 4 years ago
- last active 2 years ago
Hi
I am trying out JS SciChart based on the Blazor example you have posted more than a year ago.
I cannot get the auto scaling to work by code (the default behavior does auto scale once right after adding the data). Calling sciChartSurface.zoomExtents(); (or zoomExtentsX() and zoomExtentsY() after one another) does zoom into a very details portion of the graph.
Also (maybe related) the tooltip does not update when moving the cursor around, it always keeps the same data. I tried using CursorModifier as well as RolloverModifier, both having the same problem.
Attached the JS code and the c# files and a picture how this looks like after calling the autoScale() method.
Thanks for any help
Regards
Reto
- Reto Stahel asked 2 years ago
- last active 2 years ago
Hello, I’m using rollover modifier. By default data label is in first line, and data value is in second line. How can I modify it to have label and value in single line?
- Artur Kowalczuk asked 5 years ago
- last active 5 years ago
In version 3, I had
<ControlTemplate x:Key="RolloverLabelTemplate" TargetType="s:TemplatableControl">
  <Border Background="#77FFFFFF"
                BorderBrush="{Binding Stroke,
                                      Converter={StaticResource ColorToBrushConverter}}"
                BorderThickness="2"
                CornerRadius="5">
    <!--<StackPanel Margin="5">
                <TextBlock FontSize="12"
                           FontWeight="Bold"
                           Foreground="{Binding Stroke,
                                                Converter={StaticResource ColorToBrushConverter}}"
                           Text="{Binding SeriesName}" />
                <TextBlock FontSize="11"
                           Foreground="{Binding Stroke,
                                                Converter={StaticResource ColorToBrushConverter}}"
                           Text="{Binding Value}" />
            </StackPanel>-->
  </Border>
</ControlTemplate>

  <s:ModifierGroup>
      <s:RolloverModifier x:Name="rolloverModifier"
                                    LineOverlayStyle="{StaticResource RolloverLineStyle}"
                                    DrawVerticalLine="True"
                                    SourceMode="AllSeries"
                                    ShowTooltipOn="MouseLeftButtonDown"
                                    TooltipTemplate="{StaticResource RolloverLabelTemplate}"
                                    ShowAxisLabels="True" />
      <s:SeriesSelectionModifier ReceiveHandledEvents="True" />
    </s:ModifierGroup>

In Version 4, I get the error on the
 TooltipTemplate="{StaticResource RolloverLabelTemplate}"

An object of the type "System.Windows.Controls.ControlTemplate" cannot be applied to a property that expects the type "System.Windows.DataTemplate".

Could I get some help on this please?

Thanks,
-Robert
- Robert Zeff asked 8 years ago
- last active 8 years ago
Hi again,
Is it possible to move the rollover modifier without a touch when I know the x-axis and y-axis values?
At the moment user can tap the chart and the rollover modifier shows up and snaps to the closest point. Then I leave the rollover modifier visible by ignoring the onTouchUp() event. I have an external component that has the same data as the graph and now if user selects an item from that external component I would like to move the rollover modifier to that point. How can I do this?
- Erika Sankari asked 4 years ago
- last active 4 years ago
Hi,
I am facing a issue with RolloverModifier. I have multiple charts in single window. For some points the lines over the chart are missing.
Please find the attached images for some examples and the code for reproduce the issue. on the attachment you can see that the line on some chart is missing when mouse on left and right corner area of the chart.
Posting again because on latest version also the same issue not resolved.
https://www.scichart.com/questions/js/rollovermodifier-in-multiple-chart-line-missing-on-some-areas
- Arun Surendran asked 2 years ago
- last active 2 years ago
I have several series on a surface and currently use the Rollovermodifier. It highlights the datapoint on each series that intersects with the current vertical line of the RolloverModifier. However, I don’t seem to be able to display the corresponding y-values on the Y-Axis. How can I accomplish such? Is there any easy way to show the y-value of each series on the y-Axis that intersects with the vertical line of the Rollovermodifier?
- bbmat asked 4 years ago
- last active 4 years ago
I only want to move the RolloverModifier if the left mouse button is pressed and with Left and Right Keys?
- Daniel Hartl asked 9 years ago
- last active 9 years ago
Hi,
I’ve been trying to customize the RolloverModifier tooltip content with a vertical chart but am at a loss to try to get the format I need. I’d like to take in all the series info and display them in a tooltip together with a small icon and the y-value next to this.
I was able to do this in the CursorModifier content but unable to do so in the RolloverModifier which is what I really want to use.
I’ve included a CodeSandbox link below showing the custom SVG template and output on the CursorModifier I’d like to use for the RolloverModifier. Is this type of output template possible?
Thanks in advance!
- Craig Wendel asked 1 year ago
- last active 1 year ago
I set a rolloverModifier to a CandlestickSeries, but I can not find a API to hide RolloverMarker,I only find a article about WPF(https://www.scichart.com/documentation/v5.x/webframe.html#RolloverModifier.html), how could I hide RolloverMarker or change the style of RolloverMarker in Android?

- jiahao li asked 4 years ago
- last active 4 years ago
Hello,
I am currently using a rollover modifier to display tooltip values on the trend. Whenever a data point is clicked however, the trend stretches so this point is along the right hand axis, and it pans so this point is along the x-axis. Is there a way to disable this feature?
Here are my modifier declarations:
<SciChart:SciChartSurface.ChartModifier>
            <SciChart:ModifierGroup>
                <SciChart:RubberBandXyZoomModifier  IsXAxisOnly="False"/>
                <SciChart:XAxisDragModifier/>
                <SciChart:CursorModifier ShowAxisLabels="False"/>
                <SciChart:RolloverModifier ReceiveHandledEvents="False" ShowTooltipOn="Always" ShowAxisLabels="True" UseInterpolation="True" SnapsToDevicePixels="False" TooltipLabelTemplate="{StaticResource RolloverLabelTemplate}"/>
            </SciChart:ModifierGroup>
        </SciChart:SciChartSurface.ChartModifier>
Thanks,
Andrew
- Andrew Moghadam asked 9 years ago
- last active 9 years ago
Hi,
I’m trying to convert Java code to swift and I need the RolloverModifier class’s updateCurrentPoint method. I create CustomRolloverModifier class inherits from SCIRolloverModifier class and import SciChart.Protected.SCIRolloverModifier extension too. But i can’t find updateCurrentPoint method. What is the updateCurrentPoint equivalent method on swift?
Thanks.
- Emre Gökberk asked 4 years ago
- last active 4 years ago
In the Knowledge Base, an article discusses a rollover modifier that utilises a vertical hit test to draw a vertical line at the cursor and highlight the nearest point: http://support.scichart.com/index.php?/Knowledgebase/Article/View/17235/32/custom-chartmodifiers—part-1—creating-a-custom-rollover-modifier
This is perfect for data which moves/is unique along the X axis (such as time series data).
How can I best replicate this modifier for data which moves/is unique along the Y axis? Drawing a horizontal line is easy, but there is no HorizontalSliceHitTest function.
- Rick C asked 7 years ago
- last active 7 years ago
I have a chart with multiple series, and I would like to have the RolloverModifier behavior for all selected series, but with a single tooltip combining the values for all selected series rather than a separate tooltip per series (similar to the CursorModifier)
Is there a way to do one of the following?
- Merge the tooltips from the RolloverModifier?
OR - Only show the vertical crosshair from the CursorModifier, and snap the crosshair to the closest point in the series?
The RolloverModifier is closer to the behavior I want, the only change I would want is the merged tooltip.
- Brandon Dybala asked 3 years ago
- last active 2 years ago
Hi, I’m looking for a way to programmatically dismiss a RolloverModifier from a chart. I’ve been tasked with creating a user experience that does two things: 1. when a user stops scrubbing on the chart, the rollover modifier should persist, and 2. when the user taps outside of the chart the rollover modifier should disappear.
I’ve accomplished the first part of the problem by implementing a subclass of SCIRolloverModifier and overriding the onEvent(args:) function, but I cannot figure out how to dismiss the rollover modifier when the user taps outside the chart surface.
Is there a way to accomplish this?
- Tyler Williamson asked 9 months ago
- last active 9 months ago
Hi All,
Although this issue isn’t currently stopping me doing what I need to do I’m just a tad worried that I’m doing something more fundamental wrong which probably will. Anyway the question…
I have a chart with a DateTime axis to which I add two series (red and blue points) from the code behind as per the code snippet. When I run it both series are displayed correctly but the rollover bar only snaps to the second series points. If a run the mouse over a point from the first series it seems to be acknowledged as the fill colour changes but the rollover doesn’t snap to it.
The method is invoked by a button press on a parent control
public void AddTestDataSeries(double seedvalue)
{
    DateTime StartPoint = DateTime.Now;
    DateTime[] Axis = new DateTime[] { StartPoint.AddMinutes(1), StartPoint.AddMinutes(2), StartPoint.AddMinutes(3), StartPoint.AddMinutes(4), StartPoint.AddMinutes(5), StartPoint.AddMinutes(6), StartPoint.AddMinutes(7), StartPoint.AddMinutes(8) };
    double[] Series1 = new double[]{1,2,3,5,7,12,19,37};
    double[] Series2 = new double[]{10,20,30,40,50,60,70,80};

    XyDataSeries<DateTime, double> dataSeries1 = new XyDataSeries<DateTime, double> { SeriesName = "Series1" };
    for (int x = 0; x < Series1.Count(); x++)
    {
        dataSeries1.Append(Axis[x], Series1[x]);
    }
    XyScatterRenderableSeries scatterRenderSeries1 = new XyScatterRenderableSeries();
    scatterRenderSeries1.DataSeries = dataSeries1;
    scatterRenderSeries1.PointMarker = new EllipsePointMarker()
    {
        Fill = Colors.Red,
        Stroke = Colors.White,
        StrokeThickness = 2,
        Width = 10,
        Height = 10,
    };
    this.UserControlSciChartSurface.RenderableSeries.Add(scatterRenderSeries1);

    XyDataSeries<DateTime, double> dataSeries2 = new XyDataSeries<DateTime, double> { SeriesName = "Series2" };
    for (int x = 0; x < Series2.Count(); x++)
    {
        dataSeries2.Append(Axis[x].AddSeconds(30), Series2[x]);
    }
    XyScatterRenderableSeries scatterRenderSeries2 = new XyScatterRenderableSeries();
    scatterRenderSeries2.DataSeries = dataSeries2;
    scatterRenderSeries2.PointMarker = new EllipsePointMarker()
    {
        Fill = Colors.Blue,
        Stroke = Colors.White,
        StrokeThickness = 2,
        Width = 10,
        Height = 10,
    };
    this.UserControlSciChartSurface.RenderableSeries.Add(scatterRenderSeries2);

}
And the XAML is simply
<UserControl
         x:Class="SummaryDrillDownCharting.SummaryDataChartUserControl"
         xmlns="http://schemas.microsoft.com/winfx/2006/xaml/presentation"
         xmlns:x="http://schemas.microsoft.com/winfx/2006/xaml"
         xmlns:mc="http://schemas.openxmlformats.org/markup-compatibility/2006"
         xmlns:d="http://schemas.microsoft.com/expression/blend/2008"
         xmlns:s="http://schemas.abtsoftware.co.uk/scichart"
         mc:Ignorable="d"
         d:DesignHeight="300" d:DesignWidth="300">

<Grid>
    <s:SciChartSurface x:Name="UserControlSciChartSurface" s:ThemeManager.Theme="Chrome">

        <s:SciChartSurface.XAxis>
            <s:DateTimeAxis GrowBy="0.1, 0.1"/>
        </s:SciChartSurface.XAxis>

        <s:SciChartSurface.YAxis>
            <s:NumericAxis GrowBy="0.1, 0.1" DrawMajorBands="True"/>
        </s:SciChartSurface.YAxis>

        <s:SciChartSurface.ChartModifier>
            <s:ModifierGroup>
                <s:RolloverModifier IsEnabled="True"></s:RolloverModifier>
            </s:ModifierGroup>
        </s:SciChartSurface.ChartModifier>

    </s:SciChartSurface>
</Grid>
ADDITIONAL INFO: I Just ran the same code changing the scatter to a FastLineRenderableSeries – same problem exists.
- Stuart McCullough asked 9 years ago
- last active 9 years ago
A question was recently asked on priority support tickets – how to to apply a Template Selector to the RolloverModifier, to display different tooltips based on series type?
We are answering the question below so that other users can benefit from it!
- Andrew Burnett-Thompson asked 9 years ago
- last active 9 years ago
I need to implement custom html legend instead of built-in options.
To hide built-in rollover I’m using series config:
    this.series.rolloverModifierProps.width = 0;
    this.series.rolloverModifierProps.height = 0;
    this.series.rolloverModifierProps.markerColor = "rgba(255, 255, 255, 0)";
I can’t set
rolloverModifierProps.showRollover = false;
because in that case rolloverModifierProps.tooltipDataTemplate handler is not firing.
My handler looks like
rolloverModifierProps.tooltipDataTemplate = (seriesInfo: SeriesInfo): string[] => {
            const ohlcInfo = seriesInfo as OhlcSeriesInfo;
            myOwnHandlerToPassDataToHtml({ high: ohlcInfo.highValue, low: ohlcInfo.lowValue, open: ohlcInfo.openValue, close: ohlcInfo.closeValue });
            return [];
        };
I’am wondering if there is any other way to hide rollover marker but keep tooltipDataTemplate handler firing?
- Sergey Chernyakov asked 2 years ago
- last active 2 years ago
Thank you for your previous response however I would like to know how to recover the Date value from the AxisInfo parameter of the updateInternal method of the AxisToolTip class when used with a DateAxis.
To give context to the question. I am using a DateAxis for the xAxis on this chart and specifying a customised AxisInfoProvider as in the ‘CustomizationRolloverModifierTooltips’ example. When the RolloverModifier highlights some points and if ShowAxisLabels is true then the customised version of the updateInternal method of a customised AxisToolTip is called to to display the xAxis value on the axis.
The AxisInfo object contains a dataValue member variable the question then is: how to convert this back to a Date object.
- Simon Barnes asked 6 years ago
- last active 6 years ago
Hi,
the Tooltip from the rolloverModifier shows for the Open-Values the Label “Open”.
I would like to be able to change that. There might be serveral reasons for that. Maybe the shown data are not “openValues” or the word “open” needs to be translated into another language.
I managed to edit the title of a FastCandlestickRenderableSeries by setting a title and get it into the variable like this:
rolloverTitle = newtitle;
renderableSeries0.rolloverModifierProps.tooltipTitle = rolloverTitle;
unfortunately i did not find a way to set the name/label for the open-,low-,close-, or high-values of this Series.
Can someone give ma a hint how to do this?
- Sebastian Affeld asked 7 months ago
- last active 7 months ago
I am looking to customize the shape of the rollover vertical line (Android) – particularly, make it dashed and potentially increase the line thickness.
I saw that this is possible for WPF (https://www.scichart.com/questions/wpf/crosshair-cursormodifier-color-and-thickness), but was not able to find any information for Android.
Is this styling capable in Android?
- Eyram Dornor asked 2 years ago
- last active 2 years ago
Dear All:
I have been looking for a good way to obtain data from a multi-line chart (more than 1 y-value/y-axis) by either clicking an area that’s highlighted with a vertical line rollover, or selected with a vertical slice.
Basically I would like to take the data that I see in the Series Vertical Slices example, and extract the X-Axis values, as well as the Curve A, Curve B, and Curve C values that are shown on the vertical slice, so that I can insert that in something like a TextBox in a WPF.
Any idea how to do this, as well as with MVVM? (Will use MVC if necessary).
Thanks kindly!
— A
- Ari Sagiv asked 8 years ago
- last active 8 years ago
Hi
I’m having trouble making the RolloverModifier TooltipLabels stay inside the graphs canvas.

As you can see on the left most graph the colored sqaures and some of the digits has fallen outside the graphs canvas.
Also what are the TooltipLabels rules for clustering together, and rules for which side of the RolloverMarker the labels should appear on?
Still having a problem here… After setting the ClipModifierSurface on the SciChartSurface to False the time axis no longer clips the TooltipLabels.
But the graph itself clips the TooltipLabels when the label gets to large.
How do I make the labels stay inside the graph? As there is a lot of free space to the right of the labels.

- Sander Struijk asked 10 years ago
- last active 10 years ago
Hi,
Is it possible to require two finger touch to pan the chart horizontally? I have a line chart with a rollover modifier so I don’t want to pan when I am moving the rollover modifier.
- Erika Sankari asked 4 years ago
- last active 4 years ago
Hi,
I am facing a issue with RolloverModifier. I have multiple charts in single window. For some points the lines over the chart are missing.
Please find the attached images for some examples and the code for reproduce the issue. on the attachment you can see that the line on some chart is missing when mouse on left and right corner area of the chart
- Arun Surendran asked 2 years ago
- last active 2 years ago
Hi there:
I am developing an application where the main chart is a heat map type one. I would like to have a custom cursor modifier to show some values of the x, y and z axes with limit digits. The problem is that so far I get these result:
EDIT: PLEASE INSERT AN IMAGE HERE
I would like to show only 1 decimal in the Z axis and 0 decimals en the X and Y axis. I have checked your modifiers demo but it seems to be not working for my heatmap chart. Any kind of advice about this issue would help me to have the application I am looking for.
The XAML of my chart is like this:
 <s:SciChartSurface x:Name="sciChart" Grid.Column="1" Grid.Row="3" Padding="0" BorderThickness="0" MouseDown="SciChart_MouseDown" Margin="0">
            <s:SciChartSurface.RenderableSeries>
                <s:FastUniformHeatmapRenderableSeries x:Name="heatmapSeries"
                                                      Opacity="0.9"/>
            </s:SciChartSurface.RenderableSeries>

            <s:SciChartSurface.XAxis>
                <s:NumericAxis DrawMajorBands="True"
                               DrawLabels="False"
                               TextFormatting="0N"
                               GrowBy="0, 1"
                               s:RolloverModifier.AxisLabelContainerStyle="{StaticResource AxisLabelStyle}"
                               s:RolloverModifier.AxisLabelTemplate="{StaticResource AxisLabelTemplate}"
                               s:CursorModifier.AxisLabelContainerStyle="{StaticResource CursorAxisLabelStyle}"/>
            </s:SciChartSurface.XAxis>

            <s:SciChartSurface.YAxis>
                <s:NumericAxis DrawMajorBands="True"
                               GrowBy="0, 1"
                               DrawLabels="False"
                               VisibleRange="0,249"
                               TextFormatting="0"/>
            </s:SciChartSurface.YAxis>

            <s:SciChartSurface.ChartModifier>
                <s:ModifierGroup>
                    <s:RolloverModifier x:Name="RolloverModifier"
                                    IsEnabled="True"
                                    ShowTooltipOn="Always" />
                    <!--<s:CursorModifier IsEnabled="True" ShowTooltip="True" ShowTooltipOn="MouseOver"
                        ShowAxisLabels="true" SourceMode="AllSeries"/>-->
                    <s:CursorModifier x:Name="CursorModifier"
                                  IsEnabled="False"
                                  UseInterpolation="False"
                                  ShowAxisLabels="False"
                                  ShowTooltip="True"
                                  ShowTooltipOn="MouseOver"/>
                    <!--<s:VerticalSliceModifier IsEnabled="True">
                        <s:VerticalSliceModifier.VerticalLines>
                            <s:VerticalLineAnnotation IsEditable="false"
                                                  LabelPlacement="Axis"
                                                  ShowLabel="true"
                                                  LabelTextFormatting="0"/>
                        </s:VerticalSliceModifier.VerticalLines>
                    </s:VerticalSliceModifier>-->
                </s:ModifierGroup>

            </s:SciChartSurface.ChartModifier>
        </s:SciChartSurface>
Thanks in advanced.
- Javier Martínez Gutiérrez asked 5 years ago
- last active 5 years ago
How to do that? Let’s use the SciTrader as the example. We have CandlestickRenderableSeries, Ma500, Ma200 series on the chart. In rollover mode, I only want the CandlestickRenderableSeries show its tooltip. Please help.
Many thanks!
regards
Chunxi
- chunxi asked 9 years ago
- last active 9 years ago
hello, i use RolloverModifier on my chart, can i hide Pointmarker?
- Chia Hsin Hu asked 5 years ago
- last active 5 years ago
Hi,
I’m using the rollover modifer on some charts. I’m using an XYDataSeries<int, int>. However, the tooltip is displaying the Y values as decimal with 3 floating precision (screenshot attached), while what I want is a simple integer to show. Here’s the chart code in xaml:
<s:SciChartSurface FlowDirection="LeftToRight" s:ThemeManager.Theme="Chrome" SeriesSource="{Binding Series}" ChartTitle="{Binding Title}" HorizontalAlignment="Stretch" VerticalAlignment="Stretch" Name="chrtSurface" MouseDoubleClick="ChrtSurface_OnMouseDoubleClick" Tag="{Binding}">
                                <s:SciChartSurface.XAxis>
                                    <s:NumericAxis LabelProvider="{Binding LabelProvider}" AutoTicks="False" MajorDelta="1" MinorDelta="1" DrawMinorGridLines="False">
                                    </s:NumericAxis>
                                </s:SciChartSurface.XAxis>

                                <s:SciChartSurface.YAxis>
                                    <s:NumericAxis GrowBy="0,1" AxisTitle ="{Binding YAxisLabel}">
                                    </s:NumericAxis>
                                </s:SciChartSurface.YAxis>

                                <s:SciChartSurface.ChartModifier>
                                    <s:ModifierGroup>
                                        <s:LegendModifier GetLegendDataFor="AllSeries" ShowLegend="{Binding IsMultiChart}" ShowVisibilityCheckboxes="False">
                                            <s:SciChartLegend Margin="23,23" Orientation="Horizontal" LegendData="{Binding SeriesInfos}" >
                                            </s:SciChartLegend>
                                        </s:LegendModifier>
                                        <s:RubberBandXyZoomModifier IsXAxisOnly="True" />
                                        <s:ZoomExtentsModifier ExecuteOn="MouseRightButton"/>
                                        <s:RolloverModifier ShowAxisLabels="{Binding IsNotEmptyChart}"></s:RolloverModifier>
                                        <s:MouseWheelZoomModifier></s:MouseWheelZoomModifier>
                                    </s:ModifierGroup>
                                </s:SciChartSurface.ChartModifier>
                            </s:SciChartSurface>
- cabdo asked 9 years ago
- last active 9 years ago
