When search this forum, I found that we can achieve it by adding point marker. But I am getting this error when trying to add point marker :
‘Operation: setPointMarker: is not avaliable on type: SCIHorizontallyStackedColumnsCollection’
let me know this feature(round top corners of bars) is availble or not ! Or is there any way to do this ?
- Nathaniel Thomas asked 4 years ago
- last active 4 years ago
Hi All,
This is a very similar issue to the following forum entry – the only difference being that I’m using a StackedColumnRenderableSeries rather than a FastColumnRenderableSeries :
I gathered from the above that there may be a problem with small data values but I’ve been using a set of test points ranging in value from 10 to 50 (although ultimately i’ll be using values in the e-5 range) and have tried setting the ZeroLineY value as suggested but to no avail. Following Nazar’s comments in the other forum entry, it seems there is something to do with calculating a value from the column width and I’m wondering if the side-by-side nature of the StackedColumnRenderableSeries has something to do with the problem.
I put a single series on the chart and it displays as expected – all I then do is change the axis type in the XAMl as follows:
            <!-- WORKING but obviously doesn't display in log format -->
        <s:SciChartSurface.YAxis>
            <s:NumericAxis AutoRange="Always" AxisAlignment="Left" AxisTitle="Pressure" ScientificNotation="E" TextFormatting="#.#E+0" CursorTextFormatting="#.#E+0" GrowBy="0.0, 0.1"/>
        </s:SciChartSurface.YAxis>

        <!-- NOT WORKING creating blank chart devoid of even the gridlines -->
        <s:SciChartSurface.YAxis>
            <s:LogarithmicNumericAxis AutoRange="Always" AxisAlignment="Left" AxisTitle="Pressure" TextFormatting="#.#E+0" CursorTextFormatting="#.#E+0" GrowBy="0.0, 0.1"/>
        </s:SciChartSurface.YAxis>
I’m on version 3.4.0.6319 – I’ve just realized that one of my last posts was fixed by a later release and I should have checked that first. oh well, I’m here now!!!
Any ideas anyone?
/Stu
- Stuart McCullough asked 9 years ago
- last active 9 years ago
Referring to the stacked column side by side example in the android examples collection, if someone clicks on a column/series in that chart, how could i identify which the of columns has been selected (usa, china, india, etc).
- Marcus Maringer asked 3 years ago
- last active 3 years ago
Hi sir,
We would like to build a real time updated stackedcolumn chart in mvvm mode.
Is that possible? (x-axis on the left side)(y-axis on the bottom side which can keep update with only 10mins range)
I wonder can I use the StackedColumnRenderableSeriesForMvvm?
I found out this control but have no idea how to use it…
- Wade Yao asked 3 years ago
- last active 3 years ago
Hi,
I need create a columnChart with multiple Column value.
If I create a datapoint with 0 in Y value I have a flat red line
{
    XyDataSeries<DateTime, double> Serie = new XyDataSeries<DateTime, double>();
    foreach (var point in Ohlcvs)
        Serie.Append(point.THE_DATE, (point.O < point.C) ? point.V : 0);
    var ser = new StackedColumnRenderableSeries
    {
        DataSeries = Serie,
        StackedGroupId = "VolumeId",
        FillBrush = ColorCode.StockUp,
        SeriesColor = ColorCode.StockUp.Color,
        DataPointWidth = 0.8
    };
    ChartVolume.RenderableSeries.Add(ser);
}
{
    XyDataSeries<DateTime, double> Serie = new XyDataSeries<DateTime, double>();
    foreach (var point in Ohlcvs)
        Serie.Append(point.THE_DATE, (point.O > point.C) ? point.V : 0);
    var ser = new StackedColumnRenderableSeries
    {
        DataSeries = Serie,
        StackedGroupId = "VolumeId",
        FillBrush = ColorCode.StockDown,
        SeriesColor = ColorCode.StockDown.Color,
        DataPointWidth = 0.8
    };
    ChartVolume.RenderableSeries.Add(ser);
}
when StackedColumnRenderableSeries is used with different number of datapoint in the each serie I have this bug
    {
        XyDataSeries<DateTime, double> Serie = new XyDataSeries<DateTime, double>();
        foreach (var point in Ohlcvs.Where(o=>o.O<o.C))
            Serie.Append(point.THE_DATE, point.V );
        var ser = new StackedColumnRenderableSeries
        {
            DataSeries = Serie,
            StackedGroupId = "VolumeId",
            FillBrush = ColorCode.StockUp,
            SeriesColor = ColorCode.StockUp.Color,
            DataPointWidth = 0.8
        };
        ChartVolume.RenderableSeries.Add(ser);
    }
    {
        XyDataSeries<DateTime, double> Serie = new XyDataSeries<DateTime, double>();
        foreach (var point in Ohlcvs.Where(o => o.O > o.C))
            Serie.Append(point.THE_DATE, point.V);
        var ser = new StackedColumnRenderableSeries
        {
            DataSeries = Serie,
            StackedGroupId = "VolumeId",
            FillBrush = ColorCode.StockDown,
            SeriesColor = ColorCode.StockDown.Color,
            DataPointWidth = 0.8
        };
        ChartVolume.RenderableSeries.Add(ser);
    }
In the real case , there are 8 series .
They can beings presented on the same point X or not .
Thanks
- Sylvain60 asked 9 years ago
- last active 9 years ago
Hello,
I am using two StackedColumnRenderableSeries in my chart, but following the example “Stacked Column Side by Side”.
I am trying to add a text annotation that will contain the actual value of each column at the top of the column (very similarly as it is shown on the example “Histogram”).
The problem is that I’m able to get the data point position, not each individual columns centered position.
I have inherited from StackedColumnRenderableSeries, and there’s a method called GetColumnCenterTopAndBottom but the center value is not as expected.
In the attached image I show the positions I want to get (marked in blue).
Is there a way to get these values?
Thank you.
Sebastian
- Sebastian de Ugarriza asked 8 years ago
- last active 8 years ago
Hello,
I have the need to be able to select a single column or a set of columns from either a FastColumnRenderableSeries or a StackedColumnRenderableSeries.
Is there an out-of-the-box way to do this?
If negative, could you provide me some guidance as to what I could do?
Thank you.
Kind regards,
Sebastian
- Sebastian de Ugarriza asked 8 years ago
- last active 8 years ago
Hello,
I am using StackedColumnRenderableSeries and I need annotations like in Histogram example:

    private void Window_Loaded(object sender, RoutedEventArgs e)
    {
        var brushes = new Brush[] { Brushes.Red, Brushes.Green, Brushes.Blue, Brushes.Cyan, Brushes.Gray };
        var groups = new string[] { "Group 1", "Group 2", "Group 3" };
        var datas = new Dictionary<int, double[]>()
        {
            {1, new double[]{5.0, 4.0, 3.0, 2.0, 1.0}},
            {2, new double[]{1.0, 2.0, 3.0, 2.0, 1.0}},
            {3, new double[]{1.0, 2.0, 3.0, 4.0, 5.0}}
        };
        var data = new XyDataSeries<int, double>[brushes.Length];
        for (int i = 0; i < brushes.Length; i++)
        {
            data[i] = new XyDataSeries<int, double>();
        }
        foreach (var pair in datas)
        {
            for (int i = 0; i < pair.Value.Length; i++)
            {
                data[i].Append(pair.Key, pair.Value[i]);
            }
        }

        for (int i = 0; i < brushes.Length; i++)
        {
            var renderableSeries = new StackedColumnRenderableSeries()
            {
                Fill = brushes[i],
                DataSeries = data[i],
                StackedGroupId = brushes[i].ToString(),
            };
            sciChart.RenderableSeries.Add(renderableSeries);
        }
    }
How I can add annotation for each stacked grouped column? I attached the example with my Side-By-Side chart.
Ideally, I expected the annotations to be like in attached image.
- Ivan Voyager asked 8 years ago
- last active 8 years ago
Hi, I am currently working with the DataPointSelectionModifier with StackedColumnRenderableSeriesViewModel series. I currently am able to get the data point with the correct values whenever I click on a column but it seems that I am not able to change the selection fill of the column.
All I can seem able to do is changing the color of the whole series, but that is not what I am looking for.
Best Regards.
- Felipe Gonzalez asked 6 years ago
- last active 6 years ago
After seeing some strange behavior in my application, I have a simple repro case where hiding a renderable series that’s in a vertically stacked columns collection causes the entire screen to go black. I’ll attach a full viewDidLoad() below, but here’s the basic setup:
    let rsLeftSingle = SCIStackedColumnRenderableSeries()
    rsLeftSingle.dataSeries = dataSeriesLeftSingle
    rsLeftSingle.yAxisId = yAxisLeft.axisId
    rsLeftSingle.fillBrushStyle = SCISolidBrushStyle(color: UIColor.yellow)
    rsLeftSingle.strokeStyle = SCISolidPenStyle(color: UIColor.yellow, thickness: 2.0)

    let rsLeftDouble = SCIStackedColumnRenderableSeries()
    rsLeftDouble.dataSeries = dataSeriesLeftDouble
    rsLeftDouble.yAxisId = yAxisLeft.axisId
    rsLeftDouble.fillBrushStyle = SCISolidBrushStyle(color: UIColor.blue)
    rsLeftDouble.strokeStyle = SCISolidPenStyle(color: UIColor.blue, thickness: 2.0)

    let stacks = SCIVerticallyStackedColumnsCollection()
    stacks.add(rsLeftSingle)
    stacks.add(rsLeftDouble)
    surface.renderableSeries.add(stacks)

    let legendModifier = SCILegendModifier()
    surface.chartModifiers.add(legendModifier)
That code displays a stack of yellow and blue bars, with a legend and checkboxes (both checkboxes selected). When I tap a checkbox to deselect it, the SCIChartSurface() goes blank, the legend remains on screen, and I see this message in the console:
Exception raised with reason: All stacked series in on collection should have the same amount of X Values
When I reselect that checkbox, I get my plot back.
There are no changes being made to the underlying data. Hiding/showing works correctly for horizontally stacked collection and for other renderable series types.
What’s your recommended workaround?
- Hal Mueller asked 3 years ago
- last active 3 years ago
I’m creating the series for a stacked column chart like so:
string[] categories = new string[] { "0-10", ">10-20", ">20-30", ">30-40", ">40-50", ">50-60", ">60-70" };
                    foreach (string category in categories)
                    {
                        i++;
                        Color _color = GetRandomColor(i);

                        var tempSeries = new XyDataSeries<double, double> { SeriesName = category };
                        FillDataSeries(ref tempSeries, category);

                        if (tempSeries == null) continue;

                        var tempRenderSeries = new StackedColumnRenderableSeries
                        {
                            DataSeries = tempSeries,
                            FillBrush = new SolidColorBrush(_color),
                            StackedGroupId = "currents"
                        };

                        // Add the new RenderableSeries
                        sciChart.RenderableSeries.Add(tempRenderSeries);
                    }

                    sciChart.ZoomExtents();

                    i++;
                }
The FillDataSeries method will populate the series from a .net DataSet object. The X axis contains numeric values that represent grouped direction categories and the Y axis contains numeric values representing the percentage of records for each category. The series are speed ranges.
However, my chart results in gaps in the columns.
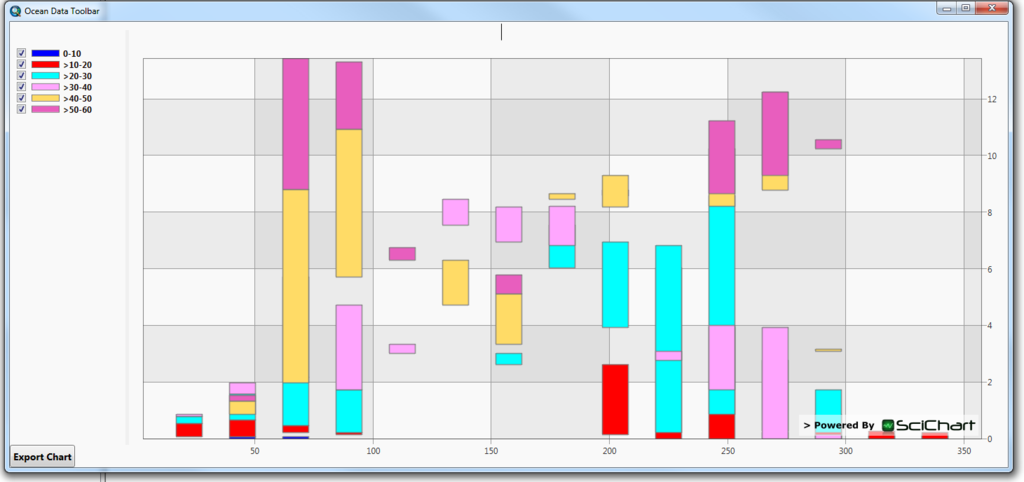
I’m not sure what causes this? Do the Series need to be zero filled for categories that have no records?
- wawr asked 9 years ago
- last active 9 years ago
I want to build a Stacked Column Side by Side Chart by referring to the reference here.
My code:
export class OutputAmplitudeComponent implements OnInit, OnDestroy {

yValues:any;
x:any;

constructor(@Inject(SETTING_SERVICE) private settingService: SettingService, private cdr: ChangeDetectorRef) {}

ngOnInit() {
                this.settingService.registerSetting(OutputAmpSetting).pipe(takeUntil(this.ngUnsubAmplitudeData)).subscribe(setting => {
                    const OutputAmplitudeData = setting.value;

                    for (let x = 1; x < this.numberOfOutput; x++) {
                        if (this.OutputMode === 'Voltage') {
                            if (phaseNum === 1) {
                                this.ampSource.data[x-1].voltage1 = OutputAmplitudeData[x];
                            } else if (phaseNum === 2) {
                                this.ampSource.data[x-1].voltage2 = OutputAmplitudeData[x];
                            } else if (phaseNum === 3) {
                                this.ampSource.data[x-1].voltage3 = OutputAmplitudeData[x];
                            }
                        } else if (this.OutputMode === 'Current') {
                            if (phaseNum === 1) {
                                this.ampSource.data[x-1].current1 = OutputAmplitudeData[x];
                            } else if (phaseNum === 2) {
                                this.ampSource.data[x-1].current2 = OutputAmplitudeData[x];
                            } else if (phaseNum === 3) {
                                this.ampSource.data[x-1].current3 = OutputAmplitudeData[x];
                            }
                        }
        this.sciChartInit();
                    }
                });
            }

xValues = this.x;

phase1:number = parseFloat(this.ampSource.data[this.x-1].voltage1);
phase2:number = parseFloat(this.ampSource.data[this.x-1].voltage2);
phase3:number = parseFloat(this.ampSource.data[this.x-1].voltage3);

async sciChartInit() {

    const { wasmContext, sciChartSurface } = await SciChartSurface.create("chart");
    const xAxis = new NumericAxis(wasmContext);
    xAxis.labelProvider.numericFormat = ENumericFormat.Decimal_0;
    sciChartSurface.xAxes.add(xAxis);
    const yAxis = new NumericAxis(wasmContext);
    sciChartSurface.yAxes.add(yAxis);

    const dataSeries1 = new XyDataSeries(wasmContext, { xValues:this.x, yValues:this.phase1, dataSeriesName: "Phase 1" });
    const dataSeries2 = new XyDataSeries(wasmContext, { xValues:this.x, yValues:this.phase2, dataSeriesName: "Phase 2" });
    const dataSeries3 = new XyDataSeries(wasmContext, { xValues:this.x, yValues:this.phase3, dataSeriesName: "Phase 3" });

    const rendSeries1 = new StackedColumnRenderableSeries(wasmContext);
    rendSeries1.fill = "#dc443f";
    rendSeries1.stroke = "black";
    rendSeries1.strokeThickness = 1;
    rendSeries1.dataSeries = dataSeries1;
    rendSeries1.rolloverModifierProps.markerColor = "#b83735";
    rendSeries1.rolloverModifierProps.tooltipColor = "#dc443f";
    rendSeries1.rolloverModifierProps.tooltipTextColor = "#fff";
    rendSeries1.stackedGroupId = "one";

    const rendSeries2 = new StackedColumnRenderableSeries(wasmContext);
    rendSeries2.fill = "#aad34f";
    rendSeries2.stroke = "black";
    rendSeries2.strokeThickness = 1;
    rendSeries2.dataSeries = dataSeries2;
    rendSeries2.rolloverModifierProps.markerColor = "#87a73e";
    rendSeries2.rolloverModifierProps.tooltipColor = "#aad34f";
    rendSeries2.rolloverModifierProps.tooltipTextColor = "#000";
    rendSeries2.stackedGroupId = "two";

    const rendSeries3 = new StackedColumnRenderableSeries(wasmContext);
    rendSeries3.fill = "#8562b4";
    rendSeries3.stroke = "black";
    rendSeries3.strokeThickness = 1;
    rendSeries3.dataSeries = dataSeries3;
    rendSeries3.rolloverModifierProps.markerColor = "#715195";
    rendSeries3.rolloverModifierProps.tooltipColor = "#8562b4";
    rendSeries3.rolloverModifierProps.tooltipTextColor = "#fff";
    rendSeries3.stackedGroupId = "three";

    const verticallyStackedColumnCollection = new StackedColumnCollection(wasmContext);
    verticallyStackedColumnCollection.dataPointWidth = 0.5;
    verticallyStackedColumnCollection.add(rendSeries1, rendSeries2, rendSeries3);
    verticallyStackedColumnCollection.animation = new ScaleAnimation({ duration: 1000, fadeEffect: true });

    sciChartSurface.renderableSeries.add(verticallyStackedColumnCollection);

    sciChartSurface.chartModifiers.add(new ZoomExtentsModifier(), new ZoomPanModifier(), new MouseWheelZoomModifier());

    sciChartSurface.zoomExtents();

    sciChartSurface.chartModifiers.add(new RolloverModifier({ rolloverLineStroke: "#228B22" }));
    sciChartSurface.chartModifiers.add(
        new LegendModifier({
            placement: ELegendPlacement.TopRight,
            orientation: ELegendOrientation.Horizontal,
            showLegend: true,
            showCheckboxes: true,
            showSeriesMarkers: true
        })
    );
    return { wasmContext, sciChartSurface };
} }
.
Error:
ERROR in output-amplitude.component.ts: - error TS2322: Type 'number' is not assignable to type 'number[]'.
const dataSeries1 = new XyDataSeries(wasmContext, { xValues:this.x, yValues:this.phase1, dataSeriesName: "Phase 1" });
node_modules/scichart/Charting/Model/XyDataSeries.d.ts:
yValues?: number[];
The expected type comes from property 'yValues' which is declared here on type 'IXyDataSeriesOptions'
.
.
I tried to parse the variables to numbers by using parseFloat in phase1 to phase3 but it did not solve error in yValues.
Any idea on the solution?
- ETS Ong asked 3 years ago
- last active 3 years ago
Hello,
I am working on a chart that contains a number of StackedColumnRenderableSeries. Each series has a unique StackedGroupId set so all of the columns display side-by-side (“grouped” mode). I have attached a screenshot of what the chart currently looks like.
The Y-values in the chart are each an average of several collected data values, so I would like to be able to include the standard deviations as error bars drawn over each column, with the center at the top of the column and the high and low values set to center+SD and center-SD.
What would be the best approach to do this? The first thing that comes to mind for me is to create a new class StackedColumnRenderableSeriesWithErrorBars which derives from StackedColumnRenderableSeries, override InternalDraw, and add the drawing of error bars to InternalDraw after calling base.InternalDraw. Of course this would only work as long as the DataSeries is an HlcDataSeries instead of an XyDataSeries.
I also considered an approach that involved overriding/modifying FastErrorBarsRenderableSeries to essentially add a “grouped” mode, but I’m not sure there’s a good way to add that.
I believe the StackedColumnRenderableSeriesWithErrorBars approach will work, but I want to make sure I’m not missing a simpler approach that I could take instead. Any help would be greatly appreciated.
Thank you!
UPDATE: I have it working to the point where it draws the error bars, but the X coordinate is always in the middle of the group, rather than being centered in the middle of the column. I assume I need to make use of the Wrapper (IStackedColumnsWrapper) in the StackedColumnRenderableSeries to shift the X coordinate, but I’m having a little trouble figuring out exactly how. Here is what I have thus far:
public class StackedColumnRenderableSeriesWithErrorBars : StackedColumnRenderableSeries
{
    public bool ShowErrorBars { get; set; } = false;

    protected override void InternalDraw(IRenderContext2D renderContext, IRenderPassData renderPassData)
    {
        base.InternalDraw(renderContext, renderPassData);

        // Now that the main drawing of the StackedColumnRenderableSeries is done, draw the error bars (if applicable).
        if (ShowErrorBars)
        {
            // The resampled data for this render pass
            // Don't try to draw error bars if the PointSeries isn't an HlcPointSeries.
            if (renderPassData.PointSeries is not HlcPointSeries dataPointSeries)
            {
                return;
            }
            ICoordinateCalculator<double> xCalc = renderPassData.XCoordinateCalculator;
            ICoordinateCalculator<double> yCalc = renderPassData.YCoordinateCalculator;

            // Iterate over the point series
            for (int i = 0; i < dataPointSeries.Count; i++)
            {
                // Get the values
                double x = dataPointSeries.XValues[i];
                double high = dataPointSeries.HighValues[i];
                double low = dataPointSeries.LowValues[i];

                // Transform to coordinate
                double xCoord = xCalc.GetCoordinate(x);
                double highCoord = yCalc.GetCoordinate(high);
                double lowCoord = yCalc.GetCoordinate(low);

                // TODO: Use Wrapper to transform the X coordinate based on where in the group this column is.

                // TODO: Set cap width based on column width
                double capWidth = 10;

                using IPen2D pen = renderContext.CreatePen(Colors.Black, true, 2);
                // Draw vertical line
                renderContext.DrawLine(pen, new Point(xCoord, highCoord), new Point(xCoord, lowCoord));
                // Draw top cap
                renderContext.DrawLine(pen, new Point(xCoord - (capWidth / 2), highCoord), new Point(xCoord + (capWidth / 2), highCoord));
                // Draw bottom cap
                renderContext.DrawLine(pen, new Point(xCoord - (capWidth / 2), lowCoord), new Point(xCoord + (capWidth / 2), lowCoord));
            }
        }
    }
}
- Michael LaBossiere asked 3 years ago
- last active 3 years ago
Hello support team,
I’m using a SciChartSurface Chart with a CategoryDateTimeAxis (xAxis).
The chart should contain three stacked bar columns and Annotations between the columns.
How can I place the Annotations exactly between the columns with consideration of the dynamic width of chart surface? I haven’t found the exactly property or solution for this particular case.
Thanks for your support in advanced!
- Miriam Moser asked 10 months ago
- last active 10 months ago
Hello,
I have a SciChartSurface with multiple StackedColumnRenderableSeries. The goal is to create a column style “Stacked Graph”.
The StackedColumnRenderableSeries are created this way:
private StackedColumnRenderableSeries[] m_layers = new StackedColumnRenderableSeries[0];
  -------
    while (num  > m_layers.Length)
              {
                  StackedColumnRenderableSeries layer = new StackedColumnRenderableSeries()
                  {
                      DataPointWidth = 0.9,
                      Fill = new SolidColorBrush(DefaultMainColorOfCurrentSetting),
                      Stroke = Colors.Black,
                      ShowLabel = false
                  };

                      layer.DataSeries = new XyDataSeries<double, double>();
                      layer.DataSeries.AcceptsUnsortedData = true;

                  m_sciChartSurface.RenderableSeries.Add(layer);

                  List<StackedColumnRenderableSeries> temp = m_layers.ToList();
                  temp.Add(layer);
                  m_layers = temp.ToArray();

              }
Later, they are fed data with this function:
void addBar(double[] layerValues)
          {

              using (m_sciChartSurface.SuspendUpdates())
              {
                  for (int i = 0; i < m_layers.Length; i++)
                  {
                      XyDataSeries<double, double> data = (XyDataSeries<double, double>)m_layers[i].DataSeries;
                      data.Append(m_currentTimepoint, layerValues[i]);
                  }
              }

              m_currentTimepoint++;
          }

  private int m_currentTimepoint = 1;
If I use this function within the class constructor, everything works as expected (see attached image).
However, sometimes, I receive the error message “”System.ArgumentException” in SciChart.Charting.dll The StackedColumnRenderableSeries type requires that all stacked stacked series with the same StackedGroupId have the same XValues.”
I fail to see the meaning of this message, since, the x-Value is the same for each part of the new column. Its “m_currentTimepoint”.
Additional Information:
This visualization is part of a medical monitoring software we are currently developing. If we use test data to call the addBar-Function (directly from the constructor, for example), the error does not appear. However, if we use data from our medical sensors, it appears. In both cases, the addBar-Function receives valid data (no NaN´s or such things)
The function is not called often, about once every 10 seconds.
Thank you
- Marc Vahldieck asked 7 months ago
- last active 7 months ago
