Hello,
I have a SciChart with as XAxis a DateTimeAxis and a dynamic/changing number of YAxes. Under the chart I have two DatePickers, the left one linked to the start of the DateTimeAxis, the right one linked to the end of the DateTimeAxis.
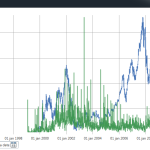
Now I would like to horizontally align these DatePickers right under the XAxis (so not just under SciChartSurface, see attached screenshot). How do I do this ? Note that the number of YAxes change, so I cannot just hardcode a margin.
Thanks in advance for any help,
Stefaan
- srillaert asked 10 years ago
- You must login to post comments
Hi Stefaan,
The SciChartSurface.AxisAreaLeft, AxisAreaRight properties might be able to help you here. These define the AxisArea controls which contain the axes on the left and right of the chart. For instance, you might want to listen to the UserControl Resize event and place DatePickers in a canvas just below the main SciChartSurface as the control resizes.
You should also see Real Time Ticking Stock Charts example, which does some hackery to make the Overview control the exact width of the SciChartSurface.XAxis.
Hope this helps!
Andrew
- Andrew Burnett-Thompson answered 10 years ago
 Thanks Andrew, this helped ! The critical part of my code for this is now : DependencyPropertyDescriptor.FromProperty(FrameworkElement.ActualWidthProperty, typeof(FrameworkElement)).AddValueChanged(sciChartSurface.AxisAreaLeft, RecalculatePeriodSelectorMargin); Enjoy the evening, Stefaan
- You must login to post comments
Please login first to submit.

