I want to put multiple Line Charts on a standard WPF TabControl. One Chart per tab.
Each tab should show a different chart with, in general, a different range on its X axis.
After a chart on a tab has been panned or zoomed, then after switching to another tab and then returning to the original tab, then the original X axis values should be preserved.
My problem is that I end up with a behaviour that looks like all the charts share one X axis.
So my question is how can I achieve the desired behaviour?
I did try databinding XAxis and, later, XAxes, but I ended up with the same behaviour.
Thanks in advance to anyone that can help me out with this.
Here is the briefest example I could construct that displays the problem.
It simply displays 3 tabs with different ranges of X values and AutoRange set to “Once”.
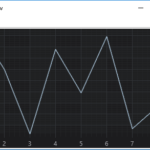
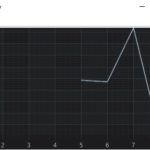
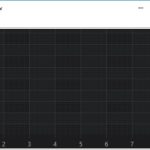
When it runs, all 3 charts are displayed with the same X axis range which is only correctly autoranged for the first tab.
The attached images are screenshots of the three tabs.
Here is my XAML:
<Window
    xmlns="http://schemas.microsoft.com/winfx/2006/xaml/presentation"
    xmlns:x="http://schemas.microsoft.com/winfx/2006/xaml"
    xmlns:local="clr-namespace:SciTest" xmlns:s="http://schemas.abtsoftware.co.uk/scichart" x:Class="SciTest.MainWindow"
    Title="MainWindow" Height="300  " Width="500">
<Window.DataContext>
    <local:RSeriesSourceList/>
</Window.DataContext>


<DockPanel>
    <TabControl ItemsSource="{Binding}">
        <TabControl.ItemTemplate>
            <!--This dictates what goes in the Tab header-->
            <DataTemplate>
                <TextBlock Text="{Binding Title}" />
            </DataTemplate>
        </TabControl.ItemTemplate>
        <TabControl.ContentTemplate>
            <!--This dictates what goes in the tab page-->
            <DataTemplate>
                <s:SciChartSurface RenderableSeries="{Binding RSeries}">
                    <s:SciChartSurface.XAxes>
                        <s:NumericAxis/>
                    </s:SciChartSurface.XAxes>
                    <s:SciChartSurface.YAxes>
                        <s:NumericAxis AutoRange="Always"/>
                    </s:SciChartSurface.YAxes>
                </s:SciChartSurface>
            </DataTemplate>
        </TabControl.ContentTemplate>
    </TabControl>
</DockPanel>
And here is the code-behind for the Data Context
    class RSeriesSource
{
    public String Title { get; set; }
    public ObservableCollection<IRenderableSeries> RSeries{get;set;}
    static Random rnd = new Random(); //for generating example data
    public RSeriesSource()
    {
        RSeries = new ObservableCollection<IRenderableSeries>();
    }
    public static RSeriesSource Example(int n)
    {
        RSeriesSource res = new RSeriesSource();
        res.AddRS(n);
        res.Title = "S" + n.ToString();
        return res;
    }

    FastLineRenderableSeries AddRS(int offset)
    {
        XyDataSeries<Double, Double> Series = new XyDataSeries<Double, Double>();
        for (int ix = 0; ix < 10; ix++)
        {
            Series.Append(offset * 5 + ix, offset + rnd.NextDouble());
        }
        FastLineRenderableSeries res = new FastLineRenderableSeries();
        res.DataSeries = Series;
        //if (yAx != null)
        //    res.YAxisId = yAx.Id; //Use the Id NOT the axis
        RSeries.Add(res);
        return res;
    }
}

class RSeriesSourceList : ObservableCollection<RSeriesSource>
{
    public RSeriesSourceList()
    {
        for (int i = 0; i < 3; i++)
        {
            Add( RSeriesSource.Example(i));
        }
    }
}
- Tony_at_DataH asked 8 years ago
- last edited 8 years ago
- You must login to post comments
Hi Tony,
Is this related to this known issue with WPF TabControl Virtualization?
Best regards,
Andrew
- Andrew Burnett-Thompson answered 8 years ago
 Yes that was it. Is killing the TabControl virtualisation the recommended workaround? With simpler controls, the theory is that by judicious use of databinding the correct behaviour can be obtained. For instance, if you put a text box on a tab control then as long as the contents is databound then of course the text will persist when you move between tabs. Is there no a way to data bind the axis or visible range or something and so achieve persistence by the same means? Or am I setting off into the tar pit by even attempting that? Thanks.
- You must login to post comments
Please login first to submit.


