We need to be able to set our chart’s Y axis to be 105. When we add new series (realtime plotting) and one of the points has a value over 105 we need the chart to start auto-scaling to match that new Y value. In other words, unless the user manually zooms we always want the chart to self-resize after starting at a fixed 105 on the Y axis.
This might seem like a strange request at first but our application is expecting a real time series to plot points whose X values might go from -10 to +10; however, the Y value could go from anywhere between 0 and 100 (sometimes higher – although that is not a typical expected value). When we are auto-scaling XY values realtime with no minimal limits the series points are effectively zoomed in really close giving the user a feeling of “noise” to a series that technically doesn’t really exist.
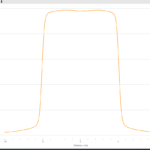
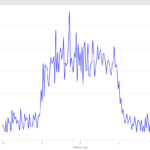
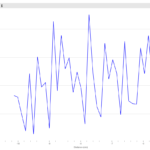
I’ve attached a couple images that demonstrate what a typical series looks like for us. Imaging if only a small portion of the series were currently on the chart and we were using auto-scaling.
Although the 2nd images is a noisy series. It’s REALLY exacerbated when the initial series is auto-scaling during the measurement making it look like the 3rd image.
- Chris Kirkman asked 4 years ago
- You must login to post comments
OK, given these requirements:
- Initial Y axis range should be 0 to 105.
- If Y axis increases beyond 105 auto-scale up.
- This applies also when I’m adding series real time.
- In the case of appending real time, this is the most important to maintain the 0 to 105 range with auto scale the Y axis when increasing beyond 105.
- Lastly, it’s also important that zooming to less than 105 is allowed.
First of all this is not what our AutoRange algorithm does, nor do I have an example of how to do exactly this, so you’re going to have to write some logic to do this. We have a similar requirement here in Tutorial 06 – Adding Realtime Updates. The requirements here are:
- Scroll the chart to show the latest 1,000 datapoints
- Allow drag to zoom the chart, or right click to pan
- When dragged or panned, stop scrolling
- Double click to resume scrolling the latest 1,000 datapoints.
I don’t have an example of exactly what you want, but I can explain how the above works so you can work toward creating your own logic.
Internally we have a property in SciChartSurface called ZoomState. This is set to UserZooming when you pan or zoom outside of ‘zoom to fit’, or AtExtents if viewing all the data. You can use this property to determine if you are zoomed in or not.
Next what we do is override the XAxis AutoRange using ViewportManager to provide the above logic. Our logic looks like this:
public class ScrollingViewportManager : DefaultViewportManager
{
    private readonly double _windowSize;
    public ScrollingViewportManager(double windowSize)
    {
        _windowSize = windowSize;
    }
    public override void AttachSciChartSurface(ISciChartSurface scs)
    {
        base.AttachSciChartSurface(scs);
        this.ParentSurface = scs;
    }
    public ISciChartSurface ParentSurface { get; private set; }
    protected override IRange OnCalculateNewXRange(IAxis xAxis)
    {
        // The Current XAxis VisibleRange
        var currentVisibleRange = xAxis.VisibleRange.AsDoubleRange();
        if (ParentSurface.ZoomState == ZoomStates.UserZooming)
            return currentVisibleRange;     // Don't scroll if user is zooming
        // The MaxXRange is the VisibleRange on the XAxis if we were to zoom to fit all data
        var maxXRange = xAxis.GetMaximumRange().AsDoubleRange();
        double xMax = Math.Max(maxXRange.Max, currentVisibleRange.Max);
        // Scroll showing latest window size
        return new DoubleRange(xMax - _windowSize, xMax);
    }
}
The comments are self explanatory, but you can see what we do here. We are basically selectively ranging the chart.
ViewportManager has a similar method for Y Range you can override. Take a look at this article:
ViewportManager – Full Control over Axis Ranges and Viewport
Best regards,
Andrew
- Andrew Burnett-Thompson answered 4 years ago
 Thanks Andrew. I’m sure this will probably be enough for me to figure it out. Thanks again for the really quick response.
- You must login to post comments
Feel free to use this class in future examples. I set the Viewport of my chart to use this class and provided for some functions to help manage the state I needed the chart to plot under. I was able to implement this from Andrew’s examples above.
    /// <summary>
/// This provides the ability to override axis ranges to the chart to meet our requirements.
///
/// Current requirement is to have the Y axis to be fixed from 0 to 105.  If a data point is
/// to be plotted above 105 then we should scale as necessary.  If the user is zooming to any
/// place in the chart we don't want to enforce the scaling rules above.  we will only enforce
/// these rules when ZoomExtents() has been called/raised by the user.  This happens when the
/// user double clicks on the chart.
///
/// There is also a case where we can have a 3rd axis (2nd y axis) and in that case we
/// will just scale that range to be based on the actual values on that axis.
/// </summary>
public class AutoScrollingViewportManager : DefaultViewportManager
{
    /// <summary>
    /// Constructor
    /// </summary>
    /// <param name="windowSize">what is the initial window size?</param>
    /// <param name="low">what is our default low end for the Y axis range?  I.e. zero.</param>
    /// <param name="high">what is our default high end for the Y axis range before any auto-resizing?</param>
    /// <param name="min">what is our default low end X axis range before any auto-resizing?</param>
    /// <param name="max">what is our default high end X axis range before any auto-resizing?</param>
    public AutoScrollingViewportManager(double low = -5d, double high = 105d, double min = -10d, double max = 10d)
    {
        DefaultMaxY = High = high;
        DefaultMinY = Low = low;

        DefaultMinX = MinX = min;
        DefaultMaxX = MaxX = max;
    }

    #region Establishes Surface
    /// <summary>
    /// We're being told about the SciChart surface to which this viewport belongs.
    /// We need to keep track of it as there is valuable information we can
    /// use later on
    /// </summary>
    /// <param name="surface">which SciChart?</param>
    public override void AttachSciChartSurface(ISciChartSurface surface)
    {
        base.AttachSciChartSurface(surface);
        ParentSurface = surface;
    }

    /// <summary>
    /// What is the current SciChart to which this viewport belongs?
    /// </summary>
    public ISciChartSurface ParentSurface { get; private set; }
    #endregion


    #region Proposed Range Adjustements
    /// <summary>
    /// Handles when the Y axis range is about to be updated
    /// </summary>
    /// <param name="yAxis">pointer to the Y axis proposed adjustment</param>
    /// <param name="renderPassInfo"></param>
    /// <returns></returns>
    protected override IRange OnCalculateNewYRange(IAxis yAxis, RenderPassInfo renderPassInfo)
    {
        DoubleRange result = null;

        // if the user has zoomed we aren't going to apply our rules
        if (ParentSurface.ZoomState == ZoomStates.UserZooming)
            result = yAxis.VisibleRange.AsDoubleRange();

        // the user is not currently involved in sizing the Y axis, we're
        // going to get involved now and enforce our rules
        else if (ParentSurface.ZoomState == ZoomStates.AtExtents)
        {
            // is this the 2nd axis?  it will be managed a little different as we won't assume the 1st
            // series to be the guy who dictates height
            if (yAxis.Id.ToLower() == "yaxis2")
            {
                // in my implementation I know that I'm adding the 2nd axis data series last
                // so I can use this logic to just fetch the 2nd axis series and define my
                // min and max based on it's values.
                XyDataSeries<double, double> last = renderPassInfo.DataSeries.Last() as XyDataSeries<double, double>;
                double minY = Convert.ToDouble(last.YMin);
                double maxY = Convert.ToDouble(last.YMax);
                result = new DoubleRange(minY * 1.05d, maxY * 1.05d);
            }
            else
            {
                // get the actual series.  not likely I won't have a series but good to check
                // regardless.
                XyDataSeries<double, double> series = renderPassInfo.DataSeries[0] as XyDataSeries<double, double>;
                if (null != series)
                    result = new DoubleRange(Low < DefaultMinY ? Low * 1.05d : DefaultMinY, High > DefaultMaxY ? High * 1.05d : DefaultMaxY);
            }
        }

        // respond with how the chart range should be defined
        return result;
    }

    /// <summary>
    /// Handles when the X axis range is about to be updated
    /// </summary>
    /// <param name="xAxis">point to the X axis proposed adjustment</param>
    /// <returns></returns>
    protected override IRange OnCalculateNewXRange(IAxis xAxis)
    {
        DoubleRange result = null;

        DoubleRange range = xAxis.VisibleRange.AsDoubleRange();

        // if the user has zoomed we aren't going to apply our rules
        if (ParentSurface.ZoomState == ZoomStates.UserZooming)
            result = range;

        // the user is not currently involved in sizing the Y axis, we're
        // going to get involved now and enforce our rules
        else if (ParentSurface.ZoomState == ZoomStates.AtExtents)
            result = new DoubleRange(MinX, MaxX);

        // respond with how the chart range should be defined
        return result;
    }
    #endregion


    #region High/Low Y range that we will enforce

    /// <summary>
    /// This is the low end of the range we want to use unless the user is zooming.
    /// </summary>
    private double Low { get; set; }

    /// <summary>
    /// Don't let the Y range get any lower than this value unless the
    /// user is zooming
    /// </summary>
    private double High { get; set; }


    /// <summary>
    /// Default value to be used when a reset happens.
    /// </summary>
    private double DefaultMinY { get; set; }

    /// <summary>
    /// Default value to be used when a reset happens
    /// </summary>
    private double DefaultMaxY { get; set; }

    #endregion

    #region Min/Max X range that we will enforce

    /// <summary>
    /// Don't let the X axis get any smaller than this unless the user is zooming
    /// </summary>
    private double MinX { get; set; }

    /// <summary>
    /// Don't let the X range get any less than this value unless the user is zooming
    /// </summary>
    private double MaxX { get; set; }

    /// <summary>
    /// Default value to be used when a reset happens.
    /// </summary>
    private double DefaultMinX { get; set; }

    /// <summary>
    /// Default value to be used when a reset happens
    /// </summary>
    private double DefaultMaxX { get; set; }

    /// <summary>
    /// Provides for the ability to update the X axis range
    /// </summary>
    /// <param name="minX">what is the new minimum allowed?</param>
    /// <param name="maxX">what is the new maximum allowed?</param>
    /// <param name="minY">what is the new minimum allowed (if less than default of zero)?</param>
    /// <param name="maxY">what is the new maximum allowed (if greater than default of zero)?</param>
    public void UpdateRange(double minX, double maxX, double minY, double maxY)
    {
        MinX = minX;
        MaxX = maxX;

        Low = minY;
        High = maxY;
    }

    /// <summary>
    /// Reset the X axis back to the initial defaults assigned to the chart
    /// </summary>
    public void ResetXAxisRange() { MinX = DefaultMinX; MaxX = DefaultMaxX; }

    #endregion
}
- Chris Kirkman answered 4 years ago
 It’s a thing of beauty!
- You must login to post comments
OK Chris so that I’ve got this right:
- You want to set the YAxis VisibleRange to 0,105 initially
- If the data exceeds that you want to zoom to fit
then what? Is that all there is to it?
If you can write the rules as a set of logical steps then I can suggest a solution for you.
Best regards,
Andrew
- Andrew Burnett-Thompson answered 4 years ago
 Andrew, Yes you are correct. 1. Initial Y axis range should be 0 to 105. 2. If Y axis increases beyond 105 auto-scale up. 3. This applies also when I’m adding series real time. (we have 2 modes, 1st is select a series that’s already complete and 2nd is to append to a series real time) 4. In the case of appending real time, this is the most important to maintain the 0 to 105 range with auto scale the Y axis when increasing beyond 105. 5. Lastly, it’s also important that zooming to less than 105 is allowed. I don’t want that initial Y axis value of 105 to be a limitation to zooming to values below 105. The primary reason for this is the use case where a user is watching a real time series plot on the chart and not have the chart auto-zoom down to Y values less than 100 since this makes the series look really noisy. Thanks, Chris
 Slightly complicated but it is possible. I will think about it…
- You must login to post comments
Please login first to submit.


