Hello.
Thank you for creating great chart library.
I’m now using a trial version for test that is enable to use at project that I’m concerned.
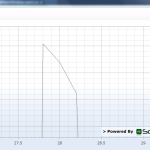
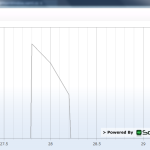
I have one problem that when I set zoom function to chart, and zoomed too much, axis label disappears.
(I used mouse scroll zoom, I attached zoom before image and after image)
How can I control this problem?
Is there any properties or setting for this?
- Hiroyuki Seki asked 8 years ago
- You must login to post comments
Update:
In SciChart v5.4.1.12135 in our Nightly Build feed, we now have a new feature which allows very high precision axis when values are very small.
Using the version above (or later), try apply this code to your Axis:
numericAxis.TickProvider = new HighPrecisionNumericTickProvider();
This has been tested and can be used to zoom many orders of magnitude smaller than 1E-12 on the NumericAxis.
Best regards,
Andrew
- Andrew Burnett-Thompson answered 5 years ago
- last edited 5 years ago
 I get a divide by zero exception, and hand to do the following to fix it public class FixedHighPrecisionNumericTickProvider : HighPrecisionNumericTickProvider { protected override IList CalculateTicks(IRange tickRange, double delta, double majorDelta, IList results) { if (delta == 0 && majorDelta == 0) return new List(); var result = base.CalculateTicks(tickRange, delta, majorDelta, results); return result; } }
- You must login to post comments
Hi Hiroyuki,
Can you tell me:
a.) What version of SciChart are you using?
b.) What is the Min, Max value of YAxis.VisibleRange when this problem occurs?
Best regards,
Andrew
- Andrew Burnett-Thompson answered 8 years ago
- You must login to post comments
Thank you for your quick response.
a.) What version of SciChart are you using?
version 3.5.0.7128
.NET Framework 4.0
b.) What is the Min, Max value of YAxis.VisibleRange when this problem occurs?
I used mouse scroll zoom to check it.
[YAxis view OK]
YAxis.VisibleRange.Min: 1.91482955526612E-11
YAxis.VisibleRange.Max: 2.13394687753202E-11
before this, YAxis shows the label.
[YAxis view NG]
YAxis.VisibleRange.Min: 1.92723671792949E-11
YAxis.VisibleRange.Max: 2.1224702520684E-11
after this, YAxis label disappears.
(Value little bit changes for each zoom and unzoom action)
For our applicaiton and project, We want to use around at 1E-15 for minimal.
- Hiroyuki Seki answered 8 years ago
- You must login to post comments
Hi Hiroyuki,
Thank you for the additional information.
Unfortunately, SciChart is only able to zoom until the X or Y Axis VisibleRange Max-Min is approximately 1E-12.
This is because all calculations within SciChart are done using 64-bit Double precision variables, and the limit of precision for Double in C# .NET is 15-16 decimal places. We need some precision to do the calculations so we have found that SciChart is usually stable up to VisibleRange Max-Min = 1E-12 but not smaller than that.
There is no 80 or 128-bit Long Double type in C#, only in C++. There is 128-bit Decimal type but this is not a floating point number type and it cannot hold the same dynamic range as C# Double can, so it is not possible to perform our calculations internally with Decimal.
Unfortunately we don’t have a workaround to zoom deeper than 1E-12. Scaling your data won’t work as you run in to the same problem – the limit of precision of C# Double type.
Sorry I can’t be more help at this time,
Best regards,
Andrew
- Andrew Burnett-Thompson answered 8 years ago
 I don't know if this will help but maybe he can multiply everything with 1000 and display the graph like that while overriding the AxisLabelsProvider.
 It might work, but it might not. In C# double the precision limit is 15-16 significant figures, not decimal places, so multiplying by 1,000 still has the same problem if you zoom in to a limit where VisibleRange Max-Min is less than 1E-12
- You must login to post comments
Please login first to submit.


