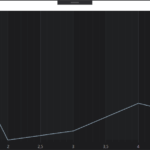
Hello. When I try to add to curve some points with very small numbers:
curve.DataSeries = chartData;
chartData.Append(1, -6.525999992441564E-04);
chartData.Append(2, -6.5259999988724722E-04);
chartData.Append(3, -6.52599999843273E-04);
chartData.Append(4, -6.5259999970558607E-04);
chartData.Append(5, -6.5259999978135147E-04);
y axis not shown labels whatever Text Formatting property for this is. What I’m doing wrong? I noticed if I add points with -3 order of value, axis labels will show.
Surface description:
<sc:SciChartSurface>
    <sc:SciChartSurface.RenderableSeries>
        <sc:FastLineRenderableSeries Name="curve"/>
    </sc:SciChartSurface.RenderableSeries>
    <sc:SciChartSurface.XAxis>
        <sc:NumericAxis/>
    </sc:SciChartSurface.XAxis>
    <sc:SciChartSurface.YAxis>
        <sc:NumericAxis TextFormatting="E3" AutoRange="Always" x:Name="yAxis"/>
    </sc:SciChartSurface.YAxis>
</sc:SciChartSurface>
- Yuriy Moskvitin asked 4 years ago
 Hi Yuriy, Thanks for your inquiry. Unfortunately, we have noticed your license support has expired. If you wish to continue receiving technical support further please consider renewing your support subscription. To do that please contact Sales here: https://www.scichart.com/contact-us/ Or email us to [email protected] If you believe this is not correct please provide your new order details. With best regards, Oleksandr
- You must login to post comments

