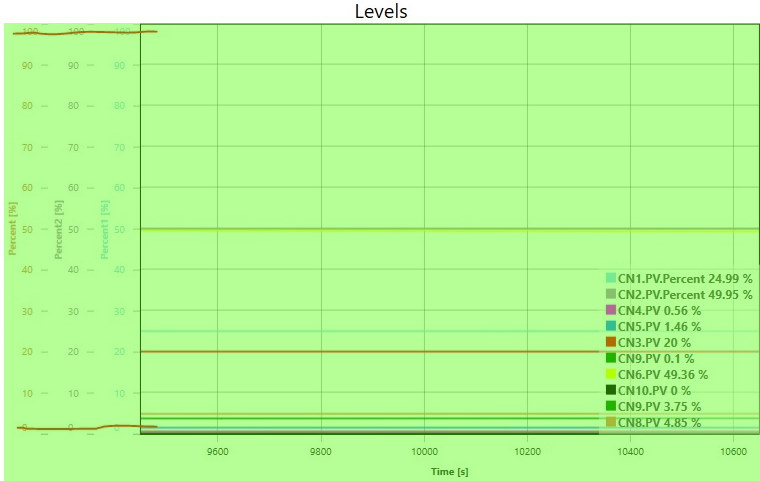
Please see attached chart that my users will be seeing.
Y axis range is from 0 to 100. Notice the axis labels, these are all aligned with other major grid lines but for the ones at the top and the bottom.
Please let us know if and how we can fix it.
- Kapil Sinha asked 2 years ago
- You must login to post comments
Hi Kapil
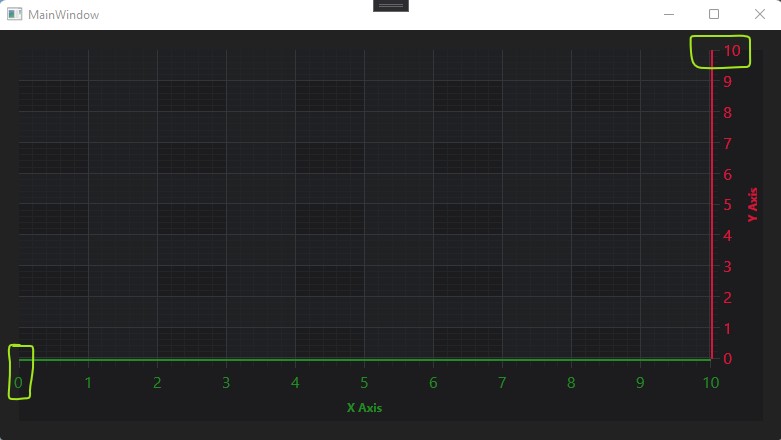
There is a good reason for this. The SciChartSurface can only draw to the area that it owns. This is shown in the green highlighted area below.
If the label were drawn any higher, it may clip to the edge of the ScichartSurface.
You can try setting AxisBase.AutoFitMarginalLabels = false, this will force the label to be shown at it’s exact location, but this might result in clipping.
Try it out, let us know if it works
Best regards
Andrew
- Andrew Burnett-Thompson answered 2 years ago
- You must login to post comments
Hi Kapil
This should be really simple to apply the AutoFitMarginalLabels property on an axis when MVVM is used. Please see our documentation page about Styling a Series in MVVM
The technique for an axis is very similar
1/ Create a Style in Xaml with a stylekey
2/ Set the AxisViewModel.StyleKey equal to that string
Now you can apply properties like AutoFitMarginalLabels in the style.
Here’s an example (full project on github)
<Window x:Class="AxisMvvmApplyStyle.MainWindow"
        xmlns="http://schemas.microsoft.com/winfx/2006/xaml/presentation"
        xmlns:x="http://schemas.microsoft.com/winfx/2006/xaml"
        xmlns:d="http://schemas.microsoft.com/expression/blend/2008"
        xmlns:mc="http://schemas.openxmlformats.org/markup-compatibility/2006"
        xmlns:local="clr-namespace:AxisMvvmApplyStyle"
        xmlns:s="http://schemas.abtsoftware.co.uk/scichart"
        mc:Ignorable="d"
        Title="MainWindow" Height="450" Width="800">
    <Window.Resources>
        <local:MainViewModel x:Key="vm"/>

        <!-- this style is applied to the YAxis by stylekey (see MainViewModel ctor) -->
        <!-- Styles can be anywhere. e.g. App.xaml, resource dictionaries or here in the same file as the SciChartSurface -->
        <Style x:Key="YAxisStyle" TargetType="{x:Type s:NumericAxis}">

            <!-- Certain properties can only be set in xaml/code, not via the viewmodel -->
            <Setter Property="BorderBrush" Value="Crimson"/>
            <Setter Property="BorderThickness" Value="2, 0, 0, 0"/>

            <Setter Property="TickTextBrush" Value="Crimson"/>

            <!-- this property allows you to override clipping of labels on the axis -->
            <Setter Property="AutoFitMarginalLabels" Value="False"/>

        </Style>

        <!-- this style is applied to the XAxis by stylekey (see MainViewModel ctor) -->
        <Style x:Key="XAxisStyle" TargetType="{x:Type s:NumericAxis}">
            <Setter Property="BorderBrush" Value="ForestGreen"/>
            <Setter Property="BorderThickness" Value="0, 2, 0, 0"/>
            <Setter Property="TickTextBrush" Value="ForestGreen"/>
            <Setter Property="AutoFitMarginalLabels" Value="False"/>
        </Style>
    </Window.Resources>

    <Grid DataContext="{StaticResource vm}" Background="#222">
        <s:SciChartSurface Margin="20"
                           YAxes="{s:AxesBinding YAxisViewModels}"
                           XAxes="{s:AxesBinding XAxisViewModels}">

        </s:SciChartSurface>
    </Grid>
</Window>

using System.Collections.ObjectModel;
using SciChart.Charting.Model.ChartSeries;
using SciChart.Data.Model;

namespace AxisMvvmApplyStyle
{
    public class MainViewModel : BindableObject // replace this for your BaseViewModel of choice
    {
        public MainViewModel()
        {
            YAxisViewModels.Add(new NumericAxisViewModel()
            {
                // Apply a style key here to apply a named style to this axis
                StyleKey = "YAxisStyle",
                AxisTitle = "Y Axis"
            });

            XAxisViewModels.Add(new NumericAxisViewModel()
            {
                StyleKey = "XAxisStyle",
                AxisTitle = "X Axis"
            });
        }

        public ObservableCollection<IAxisViewModel> YAxisViewModels { get; } =
            new ObservableCollection<IAxisViewModel>();

        public ObservableCollection<IAxisViewModel> XAxisViewModels { get; } =
            new ObservableCollection<IAxisViewModel>();
    }
}
This results in the desired behaviour:
Best regards
Andrew
- Andrew Burnett-Thompson answered 2 years ago
- You must login to post comments
See attachment
- Kapil Sinha answered 2 years ago
- last edited 2 years ago
- You must login to post comments
Perfect – got rid 10 lines of code in code behind through this trick. Also while, writing that code I introduced two bugs regarding refreshes and new axis creations. All that is gone now.
@Andrew – this trick is nice. Can you put this as part of the mvvm tutorials (if it is not there yet)? I am working with NumericAxisViewModel but I can define a style for NumericAxis
To make matters worse, i was also able to use this to pass FontFamily through data binding. Don’t know how and why but it works. It would be great if you can explain .
    <Style x:Key="YAxisStyle" TargetType="{x:Type s:NumericAxis}">

        <!-- Certain properties can only be set in xaml/code, not via the viewmodel -->
        <Setter Property="BorderBrush" Value="Blue"/>
        <Setter Property="BorderThickness" Value="2, 0, 0, 0"/>

        <Setter Property="TickTextBrush" Value="Blue"/>
        <Setter Property="FontFamily" Value="{Binding FontFamily}"/>

        <!-- this property allows you to override clipping of labels on the axis -->
        <Setter Property="AutoFitMarginalLabels" Value="False"/>

    </Style>

        YAxes.Add(new UnitAxis
        {
            DrawMajorBands = false,
            DrawMinorGridLines = false,
            DrawMinorTicks = false,
            StyleKey = "YAxisStyle",
            AxisTitle = "new Y Axis",
            FontFamily = "Arial"
        });

internal class UnitAxis : NumericAxisViewModel
{
    private string fontFamily;
    public UnitAxis()
    {

    }

    public string FontFamily { get => fontFamily; set => fontFamily = value; }
}
- Kapil Sinha answered 2 years ago
- You must login to post comments
I understand and I like the default behavior (adjusting the labels). However, there is space around the chart using padding and I need to fulfill same as before requirement.
Is there anyway I can do it through NumericAxisViewModel (set AutoFitMarginalLabels to False)? All Y Axes are being created and added in my viewmodel.
- Kapil Sinha answered 2 years ago
- last edited 2 years ago
 ok, am talking to the team about this to see if we can come up with a solution
- You must login to post comments
Please login first to submit.
