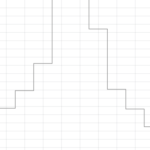
I want to reach 2 specific points:
1. Bar Chart – chart with view like digital chart but with centering like column chart. I cant use any of these because with first I cant centering point mark and with second I cant disable or change visibility of columns border.
2. Custom labels for one or more axis. For example, I have uniquely defined and limited range of double values for axis and I want to represents this values on axis labels as spcific text by relation value->string.
You can see example in the attahcments.
Is this even possible? And if possible, how can I achieve this?
- Sergey Vinogradov asked 3 years ago
- You must login to post comments
Hi Sergey
Number 2 is certainly possible out of the box. The feature you need is the LabelProvider, which you can read about here. Also related questions in our forum are How to put Strings on XAxis which has a code sample.
Number 1, we have a Digital Line chart type, but it will not centre on the X-value. If you want to specifically centre the value you would have to create a Custom RenderableSeries, which you can read about here. This uses our renderContext API and allows you to draw anything on the chart.
Let me know if this helps!
Best regards,
Andrew
- Andrew Burnett-Thompson answered 3 years ago
 Hi Andrew! Thank you for your response! LabelProvider got me exactly what i want. It’s great! I saw docs about CustomRenderableSeries and not understand clearly how to achive my point and no one more simplier way to get that? I am using MVVM with Binding to DataSeries (now it is LineRenderableSeriesViewModel), and I see it worked something differrently than LineRenderableSeries or CustomRenderableSeries. And I have an additional question. I want to get 2 and more XAxis for each DataSeries. For example, I have a data series with (X1, X2, Y) points, X1 with X2 are linearly dependent and I want to see X1 axes at Top and X2 at Bottom or vise versa. Sorry for my English. English is not my native language.
- You must login to post comments
Please login first to submit.

