Hello,
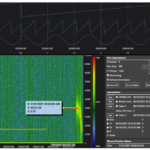
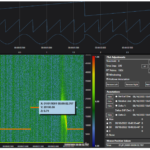
I am trying to change the frequency range in the Y axis on the Heatmap to 100000 from 50000, but the plot does not seem to be working to scale to the proper frequency range on the Y axis. I expect the plot to keep the same scale around 20000 for the upper line when I change the upper scale to 100000, but the graph scales the upper line up to 40000. I’m using function Heatmap2DArrayDataSeries() and passing the series data along with TimeFunc() for mapping to X axis and FreqFunc() for mapping to Y axis. I made some changes to FreqFunc(), but it did not change the upper line to 20000. See below for my partial code. Thanks,
    protected override void OnDisplayLoaded()
    {
    ...
    ...
        _dopplersurface.YAxes[0].VisibleRange = YVisibleRange2; // YVisibleRange2 = {0, 100000}
        _surface.UpdateLayout();

    }

    private void PlotData()
    {
    ...
        ...
        heatmap2DArrayDataSeries = new Heatmap2DArrayDataSeries<DateTime, double, double>(_spectrogramBuffer, TimeFunc, FreqFunc);
        HeatmapRenderableSeries = heatmap2DArrayDataSeries;
    }

    double FreqFunc(int iy)
    {
        double FreqDelta = 1.0 / (time_queue[1] - time_queue[0]).TotalSeconds / (FFT_Points / 2.0);
        if (((FFT_Points / 2.0) * FreqDelta / 2) < (double)YVisibleRange2.Max); // FFT_Points = 1024
        {
            FreqDelta = FreqDelta * 2;
        }
        return iy * FreqDelta / 2; // Returns 0 if iy is 0 and 50000 if iy is 512
    }

    DateTime TimeFunc(int ix)
    {
        if (time_queue.Count > (ix * Step))
        {
            DateTime DateTimeTemp1 = time_queue[ix * Step];
            return DateTimeTemp1;
        }
        else
        {
            return time_queue[time_queue.Count - 1];
        }
    }
- Hoa Duong asked 2 years ago
- You must login to post comments
Hi Hoa,
Thanks for your inquiry. I am sorry for the late reply.
Unfortunately, it’s not clear enough what you are trying to achieve. Could you please provide us with a detailed description?
You can also share a small sample project showing your current implementation either here or in the support ticket, if you don’t wish to share your code in public, here:
https://support.scichart.com/index.php?/Tickets/Submit
We have also noticed you use an outdated SciChart version. SciChart v3.x was discontinued long time ago.
We recommend using the latest SciChart version, which is v6.6.0.26505 currently. It has lots of improvements and new features since previous SciChart versions.
With best regards,
Lex
- Lex answered 2 years ago
- You must login to post comments
Please login first to submit.


