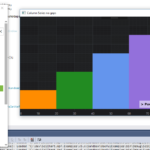
I want to create a chart with Fixed number of column series with uniform width. For example, X Asis visible range is 0-100 and i want to have 5 column series, 1st column range is 0-20, 2nd columns is 20-40, 3rd column is 40-60 ,4th coulmn is 60-80 and 5th column is 80-100. and there should not be space between columns.I have attached a screen shot of chart that i expected. Please let me know whether its possible?
Thanks
- deepak b asked 5 years ago
- You must login to post comments
Hi Deepak
What you are asking for is possible with the following code.
I have created an example on Github here
XAML Code is below.
<Window x:Class="SciChart.Sandbox.Examples.ColumnSeriesNoGaps.ColumnSeriesNoGaps"
        xmlns="http://schemas.microsoft.com/winfx/2006/xaml/presentation"
        xmlns:x="http://schemas.microsoft.com/winfx/2006/xaml"
        xmlns:d="http://schemas.microsoft.com/expression/blend/2008"
        xmlns:mc="http://schemas.openxmlformats.org/markup-compatibility/2006"
        xmlns:local="clr-namespace:SciChart.Sandbox.Examples.ColumnSeriesNoGaps"
        xmlns:s="http://schemas.abtsoftware.co.uk/scichart"
        mc:Ignorable="d"
        Title="ColumnSeriesNoGaps" Height="450" Width="800">
    <Grid>
        <s:SciChartSurface x:Name="scs">
            <s:SciChartSurface.RenderableSeries>
                <s:FastColumnRenderableSeries x:Name="columnSeries" DataPointWidth="1" UseUniformWidth="True"/>
            </s:SciChartSurface.RenderableSeries>
            <s:SciChartSurface.YAxis>
                <s:NumericAxis/>
            </s:SciChartSurface.YAxis>
            <s:SciChartSurface.XAxis>
                <s:NumericAxis VisibleRange="0,100"/>
            </s:SciChartSurface.XAxis>
        </s:SciChartSurface>
    </Grid>
</Window>
And code behind
using System.Windows;
using System.Windows.Media;
using SciChart.Charting.Model.DataSeries;
using SciChart.Charting.Visuals.PaletteProviders;
using SciChart.Charting.Visuals.RenderableSeries;

namespace SciChart.Sandbox.Examples.ColumnSeriesNoGaps
{
    //[TestCase("Column Series no gaps")]
    public partial class ColumnSeriesNoGaps : Window
    {
        public ColumnSeriesNoGaps()
        {
            InitializeComponent();

            var data = new XyDataSeries<double>();
            int offset = 10;
            data.Append(0+offset,1);
            data.Append(20 + offset, 2);
            data.Append(40 + offset, 3);
            data.Append(60 + offset, 4);
            data.Append(80 + offset, 5);
            columnSeries.DataSeries = data;
            columnSeries.PaletteProvider = new RandomColumnColorizer();
        }
    }

    public class RandomColumnColorizer : IFillPaletteProvider, IStrokePaletteProvider
    {
        private Color[] colors = new[]
        {
            Colors.DarkOrange,
            Colors.ForestGreen,
            Colors.CornflowerBlue,
            Colors.MediumPurple,
            Colors.OrangeRed
        };
        public void OnBeginSeriesDraw(IRenderableSeries rSeries)
        {
        }

        public Color? OverrideStrokeColor(IRenderableSeries rSeries, int index, IPointMetadata metadata)
        {
            return colors[index];
        }

        public Brush OverrideFillBrush(IRenderableSeries rSeries, int index, IPointMetadata metadata)
        {
            return new SolidColorBrush(colors[index]);
        }
    }
}
Best regards,
Andrew
- Andrew Burnett-Thompson answered 5 years ago
 it works great. Thanks!
- You must login to post comments
Please login first to submit.

