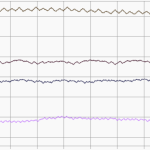
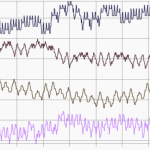
I’m implementing a toggle between joined and separated axes for my series and I’ve encountered a problem with my SeriesValueModifiers. The modifier seems to be connected to “DefaultAxisId”, when I have my series linked to an axis with that ID the values show up as expected. However, when I separate my series to individual axes the modifiers no longer appears.
Is it possible to collect and show all my SeriesValueModifiers on one axis (keeping the others invisible)? Or perhaps show modifiers on all the axes and stack them on top of each other, keeping labels invisible.
This is the code I’ve got right now:
Adding an axis in my constructor, this one will be used when all the series are using the same axis.
ChartYAxes.Add(new NumericAxis()
{
    Visibility = Visibility.Visible,
    AutoRange = AutoRange.Always,
});
Then I add a new axis for each series.
ChartYAxes.Add(new NumericAxis
{
    Id = tagName,
    Visibility = Visibility.Collapsed,
    AutoRange = AutoRange.Always
});

var renderableSeries = new FastLineRenderableSeries
{
    YAxisId = IsIsolatedCharts ? tagName : "DefaultAxisId"
};
Toggling between these works great, but I need the value labels for this to be useful in any way.
EDIT: In case it’s relevant, here’s the code for toggling.
private void SplitAxes()
{
    var count = Series.Count;
    for (int i = 0; i < count; i++)
    {
        var series = Series[i];
        var name = series.DataSeries.SeriesName;
        //The axes are also added to a dictionary for easy access.
        _axisDictionary[name].GrowBy = new DoubleRange(count - i - 1, i);
        series.RenderSeries.YAxisId = name;
    }
}

private void JoinAxes()
{
    foreach (var series in Series)
        series.RenderSeries.YAxisId = "DefaultAxisId";
}
- Hjalmar Zetterström asked 9 years ago
- last edited 9 years ago
- You must login to post comments
Hi there,
It’s not possible to do this I’m afraid.
The SeriesValueModifier is designed to work with a single axis, although you can register more than one SeriesValueModifier on a SciChartSurface and have separate YAxisIds if you wish to show series values on more than one axis, like this:
<SciChartSurface.ChartModifier>
    <ModifierGroup>
                <SeriesValueModifier YAxisId="FirstAxis"/>
                <SeriesValueModifier YAxisId="SecondAxis"/>
    </ModifierGroup>
</SciChartSurface.ChartModifier>
If you did wish to modify how the SeriesValueModifier worked, you can, but it would require access to the source-code of SciChart. If you have this, please look up SeriesValueModifier.cs in your source and look at the methods
private void AttachMarkerFor(IRenderableSeries renderableSeries)
Which defines which AxisMarkerAnnotations should be shown based on the YAxisId (and which axis they are placed on), and
public override void OnParentSurfaceRendered(SciChartRenderedMessage e)
Which places the axis markers, filtering them by Axis ID.
Sorry I cannot be more help, but its not part of the public API
Best regards,
Andrew
- Andrew Burnett-Thompson answered 9 years ago
 Ah, too bad. Would it be possible to "stack" all the Y-axes on the Z-axis? If I add the modifiers the same way I add new axes I could imitate a single axis by hiding labels and lines. Another solution could be to stack them on the Y-axis, I'm currently using GrowBy to separate the series but separating the axes that way would also work. Another solution could be to add a RolloverModifier, I have a custom one that imitates the SeriesValueModifier already. I would just have to make the labels appear outside the chart-area. As of now they just disappear behind the borders.
- You must login to post comments
Please login first to submit.


