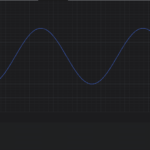
I’m trying to create a custom overview control as shown in the example with the same name, but all I get is an empty black box. The main chart is working just fine and I have it bound (for now) to the same data series as the main chart. However the only way I can get it to show anything in the overview chart is to bind it’s x and y axes to the same as the main chart, which basically makes it a copy.
            <sc:SciChartSurface x:Name="OverviewSurface" Loaded="OnOverviewSurfaceLoaded" Grid.Row="1" Margin="10,0,0,0" RenderableSeries="{sc:SeriesBinding RenderableSeriesViewModels}" >

            <sc:SciChartSurface.XAxis>
                <sc:NumericAxis DrawMajorGridLines="False" DrawMinorGridLines="False" Visibility="Collapsed"/>
            </sc:SciChartSurface.XAxis>

            <sc:SciChartSurface.YAxis>
                <sc:NumericAxis DrawMajorGridLines="False" DrawMinorGridLines="False" Visibility="Collapsed"/>
            </sc:SciChartSurface.YAxis>
        </sc:SciChartSurface>
That code above just doesn’t work at all. The RenderableSeriesViewModels are the same as bound to the main chart which is working. I’ve tried variations, using AutoRange and and creating all new ViewModels just for the overview axes but the only way I can get it to show anything at all is to bind it to the main chart axis and then I can’t hide them without hiding them on the main chart.
- Kevin Seiden asked 6 years ago
- You must login to post comments
Additional information, the problem appears to be linked with my YAxis. I was able to use the generic XAxis above and the chart still rendered as long as I keep my YAxes bound to the same view model collection as the main chart. I just can’t seem to pin down the problem with it.
- Kevin Seiden answered 6 years ago
- You must login to post comments
Please login first to submit.

