Hello,
I am trying to evaluate Scichart for purchase. I am using live data (17 Channels, many samples per second) to draw FastLineRenderableSeries (0-100% on the y axis, time on the x axis). I have everything working satisfactorily using the MVVM pattern. I have tried the HighQualityRenderSurface and Direct3D10RenderSurface.
Are these renderers actually working or am I still using the software renderer?
I need to draw a translucent rectangle on the chart to indicate a “Good” range of values of y values (say 40-50%).
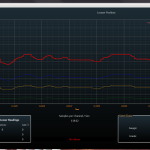
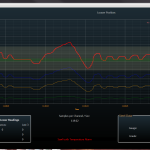
If I use annotations to draw a rectangle, everything slows down and it is unusable. If I use immediate mode drawing and the HighQualityRendererSurface it is kind of OK. If i use immediate mode drawing and the Direct3D10RenderSurface the rectangle and the series lines alternately flash slowly and it is unusable.
How can I draw a rectangle on the screen using live data and get good performance? Do I need the license for this to work well?
Thanks.
- Benjamin Kress asked 9 years ago
- You must login to post comments
Hi Benjamin,
Thank you for your enquiry! First up, the Direct3D10RenderSurface is enabled, as you can see the warning message in the top right that The Direct3D Renderer is only available in the source-code edition of SciChart. You can also verify by inspecting the type of SciChartSurface.RenderSurface at runtime.
Regarding drawing a rectangle:
I’m surprised adding a single annotation destroys the performance of the chart. Are you continually adding / removing or updating the position of the rectangle? Do you have more than one?
Using Immediate mode rendering, I’m not surprised the HighQualityRenderSurface is slow, this one uses a lot more CPU to get the job done.
Using DirectX, I am surprised you see flicker and problems here. We do occasionally see hardware-related issues with the Direct3D10Renderer and first up we always ask people to update their graphics drivers. This solves many issues related to DirectX. Secondly, we then ask for a code sample to reproduce the issue and test it out on our side. It may be a bug, or incorrect usage, or a hardware issue.
If you can send us some code I’d be glad to investigate. We’re always trying to improve our products/services.
Best regards,
Andrew
- Andrew Burnett-Thompson answered 9 years ago
- You must login to post comments
Andrew,
Thank you for the quick reply. I’m using an i7 with 8 GB of memory. I have installed another graphics card (GT 610) and made sure the drivers are up to date. I don’t get flickering anymore, but the series and the background have disappeared! If I remove the “OnDrawCallback” call in the xaml, everything works great (except no green rectangles). Perhaps I am doing something wrong. Since I’m prototyping, this is a little rough, but I’ll add what I think is the relevant code:
        <s:SciChartSurface.RenderSurface>
            <s3D:Direct3D10RenderSurface x:Name="renderSurface" MaxFrameRate="25" Draw="OnDrawCallback"/>

        </s:SciChartSurface.RenderSurface>
        <!--  Declare ChartModifiers  -->
        <SciChart:SciChartSurface.ChartModifier>
            <SciChart:ModifierGroup>
                <SciChart:LegendModifier x:Name="legendModifier" ShowLegend="{Binding ShowChartLegend}" Orientation="Vertical"  Margin="10" LegendItemTemplate="{StaticResource LegendItemTemplate}"/>
                <SciChart:SeriesSelectionModifier>
                    <SciChart:SeriesSelectionModifier.SelectedSeriesStyle>
                        <Style TargetType="SciChart:BaseRenderableSeries">
                            <Setter Property="StrokeThickness" Value="3"/>
                        </Style>
                    </SciChart:SeriesSelectionModifier.SelectedSeriesStyle>
                </SciChart:SeriesSelectionModifier>
            </SciChart:ModifierGroup>
        </SciChart:SciChartSurface.ChartModifier>
        <SciChart:SciChartSurface.YAxes>
            <SciChart:NumericAxis AxisAlignment="Left"  VisibleRange="0,100"  >
            </SciChart:NumericAxis>
        </SciChart:SciChartSurface.YAxes>
        <SciChart:SciChartSurface.XAxes>
            <SciChart:DateTimeAxis AxisTitle="Time" AutoRange="Always" >
            </SciChart:DateTimeAxis>
        </SciChart:SciChartSurface.XAxes>
    </s:SciChartSurface>
The OnDrawCallback is here:
private void OnDrawCallback(object sender , DrawEventArgs e)
{
// Get a graphics context
using (var context = e.RenderSurface2D.GetRenderContext())
        // Get a pen
        using (IBrush2D limitFill = context.CreateBrush(Colors.PaleGoldenrod, .15))
        using (IBrush2D targetFill = context.CreateBrush(Colors.Green, .2))
        {
            // Draw limits
            context.FillRectangle(limitFill, new Point(context.ViewportSize.Width, context.ViewportSize.Height * (1 - .39286)), new Point(0, context.ViewportSize.Height * (1 - .67857)));
            context.FillRectangle(targetFill, new Point(context.ViewportSize.Width, context.ViewportSize.Height * (1 - .5)), new Point(0, context.ViewportSize.Height * (1 - .53571)));
        }
    }
Declarations:
private List<IChannel> channelsToCollect;
private ObservableCollection<IChartSeriesViewModel> seriesViewModels;
public ObservableCollection<IChartSeriesViewModel> SeriesViewModels
    {
        get { return seriesViewModels; }
        set { SetField(ref seriesViewModels, value); }
    }

protected bool SetField<T>(ref T field, T value, [CallerMemberName] string propertyName = null)
    {
        if (EqualityComparer<T>.Default.Equals(field, value)) return false;
        field = value;
        OnPropertyChanged(propertyName);
        return true;
    }

protected virtual void OnPropertyChanged(string propertyName)
    {
        PropertyChangedEventHandler handler = PropertyChanged;
        if (handler != null) handler(this, new PropertyChangedEventArgs(propertyName));
    }
Here is the ViewModel Declaring the series. I basically encapsulate the series characteristics into physical Channels from the Hardware A/D converter (scaling, color, stroke thickness, etc):
private void InitializeGraphSeries()
    {
        seriesViewModels = new ObservableCollection<IChartSeriesViewModel>();
        foreach (IChannel c in channelsToCollect)
        {
            var chan = new XyDataSeries<DateTime, double>();
            chan.SeriesName = c.Name;
            //chan.AcceptsUnsortedData = true;

            var renderSeries = new FastLineRenderableSeries
            {
                SeriesColor = c.PenColor,
                StrokeThickness = c.PenWidth,
                IsVisible = c.VisibleToGraph,
                AntiAliasing = false
            };

            seriesViewModels.Add(new ChartSeriesViewModel(chan, renderSeries));
        }
    }
Here is the ViewModel handling an event from the model for new data. It basically starts when a trigger is made and then holds the graph on the screen until the trigger is activated again:
public void HandleNewDataSet (Object sender, EventArgs args)
    {
        DataSetEventArgs setArgs = (DataSetEventArgs)args;


        // Triggered on the start of the weld
        if (model.TriggerActivated == true)
        {
            if (!currentlyGraphing)
            {
                foreach (IChartSeriesViewModel v in seriesViewModels)
                {
                    v.DataSeries.Clear();
                }

                currentlyGraphing = true;
            }
            else
            {

                using (this.view.WeldChart.SuspendUpdates())
                {
                    // for each data point
                    for (int i = 0; i < setArgs.NormalizedData[0].Count; i++)
                    {
                        // for each series
                        for (int j = 0; j < seriesViewModels.Count; j++)
                        {
                            IXyDataSeries<DateTime,double> series = (IXyDataSeries<DateTime, double>)seriesViewModels[j].DataSeries;
                            //series.Append(setArgs.NormalizedData[j][i].Time, setArgs.NormalizedData[j][i].Value);
                            series.Append(DateTime.Now, setArgs.NormalizedData[j][i].Value);
                        }

                    }
                }
            }
        }
        // Only fall here if the weld just finished
        else if (currentlyGraphing)
        {
            currentlyGraphing = false;
        }
        // If not welding and  not graphing
        else
        {
            currentlyGraphing = false;
        }
    }
Again if I try annotations by adding the following (Instead of using Immediate Mode), everything slows down greatly. I don’t even need to add a rectangle in here:
<s:SciChartSurface.Annotations>
 </s:SciChartSurface.Annotations>
If I can get this solved, I can say this is a success! Thanks for all your help.
- Benjamin Kress answered 9 years ago
- You must login to post comments
Hi Benjamin,
I think you’re using the API in a way that is possible, but not intended / expected by SciChart!
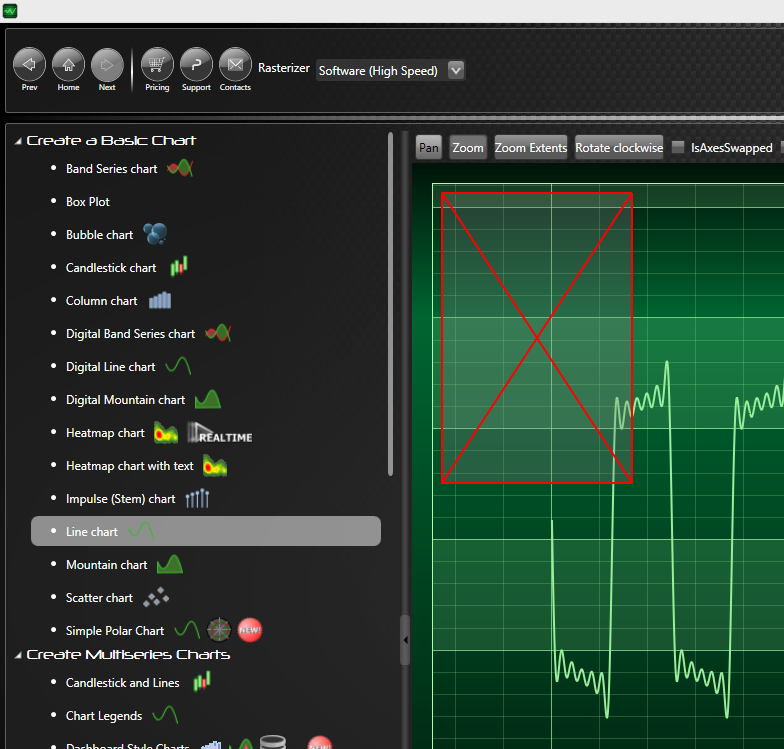
Here is one way you can get an immediate-mode render context callback to draw on.
// Subscribe to our internal message bus to get a rendered event
// Strictly speaking we don't expect this to be used by end-users but it can be! ...
// In future versions we may improve it also
sciChartSurface.Services.GetService<IEventAggregator>().Subscribe<SciChartRenderedMessage>(OnRendered);

// This is called after render and passes in the current RenderContext
private void OnRendered(SciChartRenderedMessage e)
{
    using (var pen = e.RenderContext.CreatePen(Colors.Red, true, 2.0f))
    using (var brush = e.RenderContext.CreateBrush(Colors.Gray, 0.3))
    {
        obj.RenderContext.FillRectangle(brush, new Point(10,10), new Point(200,300));
        obj.RenderContext.DrawLine(pen, new Point(10, 10), new Point(200, 300));
        obj.RenderContext.DrawLine(pen, new Point(200, 10), new Point(10, 300));
        obj.RenderContext.DrawQuad(pen, new Point(10, 10), new Point(200, 300));
    }
}
Here is the result in our Create a Simple Line Chart example

An alternative way to draw to the screen is to create a CustomRenderableSeries. Take a look at our CustomRenderableSeries API documentation and particularly the Spline Line CustomRenderableSeries example.
Hope this helps!
Best regards,
Andrew
- Andrew Burnett-Thompson answered 9 years ago
- last edited 9 years ago
- You must login to post comments
I tried your first suggestion and everything works wonderfully.
Thanks!
- Benjamin Kress answered 9 years ago
 Great! Glad we could be of help!
- You must login to post comments
Please login first to submit.


