Hi,
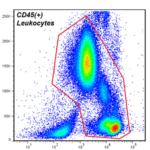
I have the necessity to allow the user to draw one or several polygons upon a heatmap chart to let him select the region he is interested in. See attached image.
I don’t want to selected the markers inside the drawn polygon, only to know the coordinates (in data coordinates, not screen) of the various point that define the polygon.
I saw that the way to do this is to use Annotations however it’s not clear to me if is it possible to have the same behaviour of the BoxAnnotation but with a polygon (without any side number limit)?
Thank you,
Raphael
- Raphael Ruis asked 7 years ago
- You must login to post comments
Hi Raphael,
Two ways to achieve this. In our SciChart WPF Examples we have published a modifier which allows the user to free-draw over the chart:
This results in the following

In addition to this, if you just wanted to draw from programmatic data, you can use our CustomRenderableSeries API?
In essence, you can override one of our series (or create your own), and draw directly to the screen using the Immediate Mode RenderContext API. Using this technique you can draw pretty much anything on the chart.
I would suggest inheriting FastHeatmapRenderableSeries and calling the base Draw method before drawing your own polygon.
e.g.
public class HeatmapSeriesEx : FastHeatMapRenderableSeries
{
    protected override void InternalDraw(IRenderContext2D renderContext, IRenderPassData renderPassData)
    {
        // Draws the base heatmap
        base.InternalDraw(renderContext, renderPassData);

        // Draw whatever you want over the top!

        // Filling polygon
        using (var brush = renderContext.CreateBrush(Color.FromArgb(0x33, 0xFF, 0x33, 0x33)))
        {
            IEnumerable<Point> points; // define your points
            renderContext.FillPolygon(brush, points);
        }

        // Drawing lines (polygon ouline)
        using (var pen = renderContext.CreatePen(Colors.Red, true, 2.0f))
        using (var lineContext = renderContext.BeginLine(pen, 10d, 10d))
        {
            lineContext.MoveTo(20, 20);
            lineContext.MoveTo(50, 100);
            lineContext.MoveTo(20, 120);
            lineContext.MoveTo(10d, 10d);
            lineContext.End();
        }
    }
}
Will allow you to draw a filled and outlined polygon over the chart from programmatic points.
Hope this helps!
Best regards,
Andrew
- Andrew Burnett-Thompson answered 7 years ago
- last edited 4 years ago
- You must login to post comments
Please login first to submit.

