Hello,
I have a chart currently working. (See attached Chart_Current.png for what I have now)
I’d like to add concentric color-filled zones to the chart, to indicate when the already existing line series enters and exits particular zones of interest. My zones are elliptical, and I need to be able to define them as such (so I do not think the “Bubble” stuff will work). I need to color in the space inside my zones, with some opacity, such that the original renderable series can still be seen. (See attached Chart_Goal.png for a crude MS Paint drawing of what I am trying to achieve.)
I have explored the WPF Examples App and seen several promising chart / series types, but I am still not sure how to proceed. It seems the HeatMap stuff will probably be useful, but I am not sure how to define my HeatMap zones elliptically.
Any tips on how to proceed would be greatly appreciated. I am just trying to get pointed in the right direction.
Thank you!
Kurt


- Kurt Madland asked 10 months ago
- You must login to post comments
Hi Kurt,
Can Custom Annotations resolve this? The Annotations feature allows you to place shapes onto the chart. We have Box, Line, Text, LineArrow out of the box and you can create Custom annotations, as well as Composite Annotations (groups of annotations) for more complex shapes.
Ellipses can be created using CustomAnnotation. There is a thread here on Oval / Circle Annotations which is quite old. In the Custom Annotation documentation there is a section on how to create a custom annotation with four corners by templating BoxAnnotation. Have a look at
CustomAnnotation (X1,Y1, X2, Y2)
The CustomAnnotation type only has a single X1,Y1 control point. If
you need to create a CustomAnnotation with two control points
(X1,Y1,X2,Y2), we recommend templating and/or subclassing the
BoxAnnotation type.For example, the following code
  <s:SciChartSurface.Annotations>
     <s:BoxAnnotation X1="2" X2="8" Y1="2" Y2="8" Background="#33FFFFFF"
                      BorderBrush="#55FFFFFF" BorderThickness="3" Padding="5">
        <s:BoxAnnotation.Template>
           <ControlTemplate TargetType="s:BoxAnnotation">
              <Border x:Name="PART_BoxAnnotationRoot"
                 Margin="{TemplateBinding Margin}"
                 Background="{TemplateBinding Background}"
                 BorderBrush="{TemplateBinding BorderBrush}"
                 BorderThickness="{TemplateBinding BorderThickness}"
                 CornerRadius="{TemplateBinding CornerRadius}">
                 <Viewbox Margin="{TemplateBinding Padding}">
                    <TextBlock Text="Hello CustomAnnotation World!"></TextBlock>
                 </Viewbox>
              </Border>
           </ControlTemplate>
        </s:BoxAnnotation.Template>
     </s:BoxAnnotation>
    </s:SciChartSurface.Annotations>
Which results in:
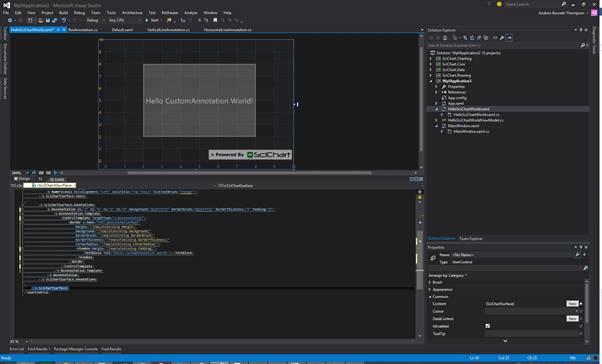
Try this technique, but substitute a WPF Ellipse shape in the control template.
Taking this a step further, use CompositeAnnotation to create an annotation group. This might allow you to place all concentric circles onto one single annotation and anything else you wanted in there, such as lines or text. See the documentation above for an example.
Let me know if this helps!
Best regards,
Andrew
- Andrew Burnett-Thompson answered 10 months ago
- You must login to post comments
Thank you Andrew! This solution is working great.
Only 1 problem: How do I make sure my Line Series is rendered on top of these new annotations? Right now the annotations are blocking the Series.
- Kurt Madland answered 10 months ago
- last edited 10 months ago
- You must login to post comments
Hi Kurt,
Please accept our apologies for the late reply.
We were reviewing forum threads and noticed this one has no answer yet.
You can place the Annotation below the RenderableSeries by setting the AnnotationCanvas property to “BelowChart”.
Please take a look at our Annotations API documentation for more information. Here is a link:
https://www.scichart.com/documentation/win/current/webframe.html#Intro%20to%20the%20Annotations%20API.html
With best regards,
Lex,
SciChart Technical Support Engineer
- Lex answered 5 months ago
- You must login to post comments
Please login first to submit.
