Hi.
In my application every series (FastLineRenderableSeries) has it’s own y axis (e.g. surface with 3 serieses will have 3 Y axes). When series is created I’m creating NumericAxis and adding it to YAxes collection. So my chart surface declared as follows (simplified view):
<s:SciChartSurface>

<s:SciChartSurface.XAxis>

<s:DateTimeAxis />

</s:SciChartSurface.XAxis>

<s:SciChartSurface>
Problem 1: when I do not declare YAxis in xaml I have problem with VerticalSliceModifier: when slice is added by user on surface the crosspoint with series is positioned correctly, but slice vertical line itself is drawn on the left side of surface and positioned correctly on some redraw (e.g. panning).

I found out that VerticalSliceModifier does not work properly if Axis is not declared, so I declared it:
<s:SciChartSurface.YAxis>

<s:NumericAxis Visibility="Collapsed"/>

</s:SciChartSurface.YAxis>
Now VerticalSliceModifier works fine, but now we come to problem 2.
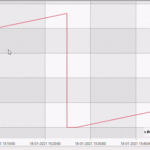
Problem 2: when YAxis declared with Visibility=”Collapsed” the chart surface squares gets wrong color (look at blinks on panning).

So I’ve got stuck in search of magic combination when everything works as expected :-).
- Grigoriy Vasilchenko asked 3 years ago
- last edited 3 years ago
- You must login to post comments
You must have an X and Y axis on the chart. Without this the chart will not draw.
To hide an axis, Visibility.Collapsed should work, however WPF will do strange things to bindings and not evaluate them on objects which are not in the Visual Tree. So this approach can work instead:
<s:NumericAxis DrawLabels="False" DrawMajorTicks="False" DrawMinorTicks="False"/>
Your first problem – ‘VerticalSliceModifier not working without a YAxis’, in your image you do have an axis, so I assume you have declared it in a ViewModel. You can try setting VerticalSliceModifier.YAxisId equal to the Axis.Id. That should also work.
Best regards,
Andrew
- Andrew Burnett-Thompson answered 3 years ago
- last edited 3 years ago
 Hi, Andrew. You are right ` s:NumericAxis Visibility=”Collapsed” ` and ` s:NumericAxis DrawLabels=”False” DrawMajorTicks=”False” DrawMinorTicks=”False” ` visual looks almost the same, but your axis declaration solves both of my problems. Thanks! About your comment regarding y axis in my first image. The proper wording is: “VerticalSliceModifier not working without a SciChartSurface.YAxis property been set”. So yes, I do have y axis in my first example (as you correctly mentioned without y axis nothing will draw), but my y axis is added to SciChartSurface.YAxes collection, and SciChartSurface.YAxis is left in its default value (null I suppose). It’s a bit confusing to me: it is not mandatory to set SciChartSurface.YAxis property (you can use SciChartSurface.YAxes collection instead), but some functions will not work properly then (as I found for now: VerticalSliceModifier, ZoomHistoryManager). Nevertheless thanks a lot for your help!
- You must login to post comments
Please login first to submit.


