Hi,
I would like to ask if there is any easy way to select distict time intervals.
I have thought of creating vertical slices on mouse down and up events,
and highlighting the surface between the slices. Is there an easier way
to do this?
Thanks,
Chris
- Kristóf Czimer asked 8 years ago
- You must login to post comments
Hi Kristóf,
Thanks for your enquiry! In SciChart we don’t (currently) have a way to do this but I’m going to give you two solutions:
In SciChart v3.x
You can use our Annotations API to draw on the screen, specifically, take a look at this thread on templating a BoxAnnotation (you can draw any UI you want if you change the template and/or subclass BoxAnnotation).
Next, how to place it on mouse-click? Well, you can either use our own AnnotationCreationModifier, or, you can create a custom ChartModifier. Have a look here at the great tutorials on the chartmodifier API, which allow mouse-input and drawing over the chart.
In SciChart v4.x
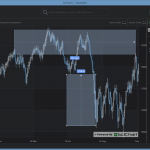
Coming soon: we have a new API to create Composite Annotations and we are creating MeasureX, MeasureY and MeasureXY annotations which do exactly this. See a screenshot below.
Best regards,
Andrew
- Andrew Burnett-Thompson answered 8 years ago
- You must login to post comments
Please login first to submit.

