Hi,
I’m currently trialing Scichart and I’m impressed by the features although the candlecharts I’ve generated are somewhat fuzzy.
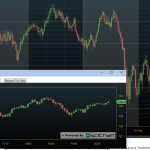
I’ve attached a screenshot showing an a chart from the examples suite vs a chart which I’ve generated. As you can see there is a clear difference between the two, in both cases it’s set to Software high speed rendering.
I took the real time ticking stock charts example as the basis for my chart where as the Scichart example in the attached screenshot uses the SCichart trader example. In the Scichart trader example custom defintions for wick colours etc… have been set, I tried to merge this into my chart to see if there would help but had difficulties as I wasn’t able to use the
settings as my chart used
<s:SciStockChart x:Name=”sciChart”
with the FastCandlestickRenderableSeries being set in the view model.
So I guess the question has two parts:
Is there a reason why the chart would be fuzzy?
Is there a way to set properties such as UpWickColor when using s:SciStockChar?
Please let me know if any of the above needs clarifying.
Thanks!
- [email protected] Douglas asked 9 years ago
- last edited 9 years ago
- You must login to post comments
Two things to check
-
You may have set FastCandlestickRenderableSeries.AntiAliasing = true (or not set it to false). This is unnecessary and will cause lines to be blended and less sharp
-
You may need to check the value of UIElement.SnapsToDevicePixels and UIElement.UseLayoutRounding on parent elements of the SciChartSurface. This property is important as it forces WPF to have round numbers for element sizes.
You can check the value of both of these properties and dynamically change them at runtime using WPF Snoop.
Hope this helps,
- Andrew Burnett-Thompson answered 9 years ago
 Thanks for the quick response Andrew. Setting AntiAliasing = false fixed it. Re. SciStockChart and SciChartSurface classes, in the example suite real time ticking stock charts uses SciStockChart where as SciChart Trader uses SciChartSurface. Is there a reason to use one over the other? There are various other examples I'd like to implement parts of and excluding real time they all seem to use SciChartSurface. Thanks Tim
 Hi Tim, glad it helped :) Scistockchart is simply a specialised form of Scichartsurface which wraps up and simplifies some common use cases. See https://www.scichart.com/questions/question/can-scichartsurface-be-used-within-scichartgroup
- You must login to post comments
Please login first to submit.

