Hello.
I am adding Double.NaN into DataSeries for X-Axis synchronization.
It works fine with 3.x version.
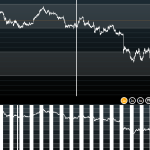
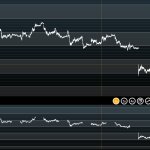
When i have updated scichart to 4.x version, i got filled areas instead of empty areas. But, these filled areas are shown only with big count of points. Filled areas disappeared when i zoom in.
This is how i create renderableseries:
new OhlcRenderableSeriesViewModel
                {
                    DataSeries = ohlc,
                    DrawNaNAs = LineDrawMode.Gaps,
                    AntiAliasing = false,
                    StrokeThickness = 1,
                    StrokeUp = color,
                    StrokeDown = color,
                    Stroke = color
                }
- Ivan Zakharov asked 8 years ago
- You must login to post comments
Hi Artur,
Thank you for reporting this. Could you please try out the latest v4.0 build avilable on NuGet ( #v4.0.4.8098)? The issue should be fixed within this update.
You can find the info on how to get nightly builds in our Knowledgebase here:
Getting Nightly Builds with NuGet
Please let us know if the issue is gone with the update,
- Yuriy Zadereckiy answered 8 years ago
 We’ve checked the current version and found out the reason why the fix hasn’t been deployed. The next update will contain it. We are going to publish it soon, within the week. Would it be OK with you?
 Yes, thanks
 Hi Artur, due to an error in our deployment v4.0.4 did not contain the fix, but v4.0.5.8114 does. Please report back if you have any further issues. Best regards, Andrew
 Hello, I am using SciChart to show continuous timestamped data from a motor controller which is captured periodically over ethernet. Sometimes sections of data is missed and I need to show this as a gap. I am using the chart gap feature by inserting a double.Nan at the start of the data arriving late. This seems to work but there are two things which I have noticed. First, sometimes an island of data shows the start point connected to the end point. Second, during a zoom in and out lines occassionaly show between the islands of data. Kind Regards, Guy Pender
 Hi Guy, I recommend you open a new forum question with screenshots and a code snippet so we can best help. Best regards, Andrew
- 1 more comment
- You must login to post comments
Please login first to submit.


