Hello! I’ve created a UserControl that houses a chart that I’m populating with StackedColumnRenderableSeriesViewModels.
XAML:
<UserControl>

<Grid>
    <sci:SciChartSurface x:Name="StackedColumnSciChart" RenderableSeries="{sci:SeriesBinding RenderableSeries, RelativeSource={RelativeSource AncestorType=UserControl}}">

        <sci:SciChartSurface.XAxis>
            <sci:NumericAxis Id="LengthAxisID" AutoRange="Never" AxisTitle="Length (mm)" />
        </sci:SciChartSurface.XAxis>

        <sci:SciChartSurface.YAxis>
            <sci:NumericAxis Id="ValueAxisID" AutoRange="Never" />
        </sci:SciChartSurface.YAxis>

    </sci:SciChartSurface>
</Grid>

</UserControl>
C#:
RenderableSeries dependency property
public ObservableCollection<IRenderableSeriesViewModel> RenderableSeries
    {
        get { return (ObservableCollection<IRenderableSeriesViewModel>)GetValue(RenderableSeriesProperty); }
        set { SetValue(RenderableSeriesProperty, value); }
    }
    public static readonly DependencyProperty RenderableSeriesProperty = DependencyProperty.Register("RenderableSeries", typeof(ObservableCollection<IRenderableSeriesViewModel>), typeof(StackedColumnChart), new PropertyMetadata(defaultValue: new ObservableCollection<IRenderableSeriesViewModel>()));
Creating StackedColumnRenderableSeriesViewModels for temperatures
foreach (PlotInfo plot in CreateTemperaturePlots())
            {
                StackedColumnRenderableSeriesViewModel stackedColumnRenderableSeries = new StackedColumnRenderableSeriesViewModel()
                {
                    Stroke = plot.Color,
                    Fill = new SolidColorBrush(color: plot.Color),
                    XAxisId = plot.XAxisID,
                    YAxisId = plot.YAxisID,
                    StackedGroupId = plot.GroupID,
                    DataSeries = plot.DoubleDataSeries
                };

                // Set the Y Axis range
                StackedColumnSciChart.YAxes[0].VisibleRangeLimit = new DoubleRange(min: 0.0, max: 1200.0);
                StackedColumnSciChart.YAxes[0].VisibleRange = new DoubleRange(min: 0.0, max: 1200.0);

                Console.WriteLine($"Temperature Plot GroupID: {plot.GroupID}, DataSeries: [X: {plot.DoubleDataSeries.XValues[0]}, Y: {plot.DoubleDataSeries.YValues[0]}]");

                RenderableSeries.Add(stackedColumnRenderableSeries);
            }
Creating StackedColumnRenderableSeriesViewModels for gases
foreach (PlotInfo plot in CreateGasPlots())
            {
                StackedColumnRenderableSeriesViewModel stackedColumnRenderableSeries = new StackedColumnRenderableSeriesViewModel()
                {
                    Stroke = plot.Color,
                    Fill = new SolidColorBrush(color: plot.Color),
                    XAxisId = plot.XAxisID,
                    YAxisId = plot.YAxisID,
                    StackedGroupId = plot.GroupID,
                    DataSeries = plot.DoubleDataSeries
                };

                // Set the Y Axis range
                StackedColumnSciChart.YAxes[0].VisibleRangeLimit = new DoubleRange(min: 0.0, max: 30000);
                StackedColumnSciChart.YAxes[0].VisibleRange = new DoubleRange(min: 0.0, max: 30000);

                Console.WriteLine($"Gas Plot GroupID: {plot.GroupID}, DataSeries: [X: {plot.DoubleDataSeries.XValues[0]}, Y: {plot.DoubleDataSeries.YValues[0]}]");

                RenderableSeries.Add(stackedColumnRenderableSeries);
            }
Temperature Data:
Temperature Plot GroupID: Group0, DataSeries: [X: 0, Y: 0]
Temperature Plot GroupID: Group1, DataSeries: [X: 200, Y: 0]
Temperature Plot GroupID: Group2, DataSeries: [X: 400, Y: 670.773630135875]
Temperature Plot GroupID: Group3, DataSeries: [X: 600, Y: 740.345771031664]
Temperature Plot GroupID: Group4, DataSeries: [X: 800, Y: 784.109352476318]
Temperature Plot GroupID: Group5, DataSeries: [X: 1000, Y: 810.433384818085]
Temperature Plot GroupID: Group6, DataSeries: [X: 1200, Y: 830.191409478306]
Temperature Plot GroupID: Group7, DataSeries: [X: 1400, Y: 851.270291157906]
Temperature Plot GroupID: Group8, DataSeries: [X: 1600, Y: 866.993960435544]
Temperature Plot GroupID: Group9, DataSeries: [X: 1800, Y: 877.308898422191]
Temperature Plot GroupID: Group10, DataSeries: [X: 2000, Y: 896.995238248967]
Temperature Plot GroupID: Group11, DataSeries: [X: 2200, Y: 910.176039942053]
Temperature Plot GroupID: Group12, DataSeries: [X: 2400, Y: 928.835289697347]
Temperature Plot GroupID: Group13, DataSeries: [X: 2600, Y: 947.442843516404]
Temperature Plot GroupID: Group14, DataSeries: [X: 2800, Y: 959.806601821192]
Temperature Plot GroupID: Group15, DataSeries: [X: 3000, Y: 962.432915671719]
Temperature Plot GroupID: Group16, DataSeries: [X: 3200, Y: 963.263705166903]
Temperature Plot GroupID: Group17, DataSeries: [X: 3400, Y: 953.094653198038]
Temperature Plot GroupID: Group18, DataSeries: [X: 3600, Y: 920.368723738552]
Temperature Plot GroupID: Group19, DataSeries: [X: 3800, Y: 0]
Temperature Plot GroupID: Group20, DataSeries: [X: 4000, Y: 0]
Temperature Plot GroupID: Group21, DataSeries: [X: 4200, Y: 0]
Temperature Plot GroupID: Group22, DataSeries: [X: 4400, Y: 0]
Temperature Plot GroupID: Group23, DataSeries: [X: 4600, Y: 0]
Gas Data:
Gas Plot GroupID: Channel571, DataSeries: [X: 600, Y: 5000]
Gas Plot GroupID: Channel571, DataSeries: [X: 600, Y: 5000]
Gas Plot GroupID: Channel572, DataSeries: [X: 800, Y: 5000]
Gas Plot GroupID: Channel572, DataSeries: [X: 800, Y: 5000]
Gas Plot GroupID: Channel573, DataSeries: [X: 1000, Y: 5000]
Gas Plot GroupID: Channel574, DataSeries: [X: 1200, Y: 5000]
Gas Plot GroupID: Channel574, DataSeries: [X: 1200, Y: 5000]
Gas Plot GroupID: Channel575, DataSeries: [X: 1400, Y: 5000]
Gas Plot GroupID: Channel575, DataSeries: [X: 1400, Y: 5000]
Gas Plot GroupID: Channel575, DataSeries: [X: 1400, Y: 5000]
Gas Plot GroupID: Channel576, DataSeries: [X: 1600, Y: 5000]
Gas Plot GroupID: Channel576, DataSeries: [X: 1600, Y: 5000]
Gas Plot GroupID: Channel576, DataSeries: [X: 1600, Y: 5000]
Gas Plot GroupID: Channel577, DataSeries: [X: 1800, Y: 5000]
Gas Plot GroupID: Channel577, DataSeries: [X: 1800, Y: 5000]
Gas Plot GroupID: Channel578, DataSeries: [X: 2000, Y: 5000]
Gas Plot GroupID: Channel578, DataSeries: [X: 2000, Y: 5000]
Gas Plot GroupID: Channel579, DataSeries: [X: 2200, Y: 5000]
Gas Plot GroupID: Channel579, DataSeries: [X: 2200, Y: 5000]
Gas Plot GroupID: Channel580, DataSeries: [X: 2400, Y: 5000]
Gas Plot GroupID: Channel580, DataSeries: [X: 2400, Y: 5000]
Gas Plot GroupID: Channel581, DataSeries: [X: 2600, Y: 5000]
Gas Plot GroupID: Channel581, DataSeries: [X: 2600, Y: 5000]
Gas Plot GroupID: Channel582, DataSeries: [X: 2800, Y: 5000]
Gas Plot GroupID: Channel582, DataSeries: [X: 2800, Y: 5000]
Gas Plot GroupID: Channel583, DataSeries: [X: 3000, Y: 5000]
Gas Plot GroupID: Channel583, DataSeries: [X: 3000, Y: 5000]
Gas Plot GroupID: Channel584, DataSeries: [X: 3200, Y: 5000]
Gas Plot GroupID: Channel584, DataSeries: [X: 3200, Y: 5000]
Gas Plot GroupID: Channel585, DataSeries: [X: 3400, Y: 5000]
Gas Plot GroupID: Channel585, DataSeries: [X: 3400, Y: 5000]
Gas Plot GroupID: Channel586, DataSeries: [X: 3600, Y: 5000]
Gas Plot GroupID: Channel586, DataSeries: [X: 3600, Y: 5000]
Gas Plot GroupID: Channel587, DataSeries: [X: 3800, Y: 5000]
Gas Plot GroupID: Channel587, DataSeries: [X: 3800, Y: 5000]
Gas Plot GroupID: Channel588, DataSeries: [X: 4000, Y: 5000]
Gas Plot GroupID: Channel588, DataSeries: [X: 4000, Y: 5000]
Gas Plot GroupID: Channel589, DataSeries: [X: 4100, Y: 5000]
Gas Plot GroupID: Channel589, DataSeries: [X: 4100, Y: 5000]
Gas Plot GroupID: Channel589, DataSeries: [X: 4100, Y: 5000]
Gas Plot GroupID: Channel590, DataSeries: [X: 4200, Y: 5000]
Gas Plot GroupID: Channel590, DataSeries: [X: 4200, Y: 5000]
Gas Plot GroupID: Channel590, DataSeries: [X: 4200, Y: 5000]
Gas Plot GroupID: Channel591, DataSeries: [X: 4300, Y: 5000]
Gas Plot GroupID: Channel591, DataSeries: [X: 4300, Y: 5000]
Gas Plot GroupID: Channel591, DataSeries: [X: 4300, Y: 5000]
With the Temperature data, each StackedColumnRenderableSeriesViewModel has its own StackedGroupId. With the Gas data, there are multiple StackedGroupIds.
I tried attaching two PNG files (60K and 70K) to this but the forum says they are forbidden. Here is a link: Gas and Temperature charts
- Greg Knox asked 4 years ago
- You must login to post comments
Hi Greg,
before I answer this, is this correct?
Temperature Data
- Your chart has 24 Stacked Series for Temperature data
- and each series has a DataSeries with one data-point.
- Each dataseries in a different stacked group
Gas data
- Your chart has 46 Stacked Series for Gas data
- and each series has a DataSeries with one data-point
- Some are in same stacked group, some differ
The expected rendering of this would be as follows (see documentation)
Columns with different StackedGroupId
These would render side by side like this:
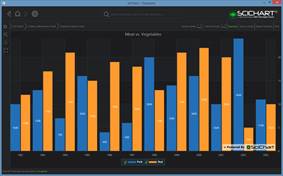
However, since each series has one data-point, then the SciChartSurface might struggle to decide what the width of a column should be (since column width is decided on by number of data-points / size)
Columns with same StackedGroupId
These would render like this stacking on top of each other:
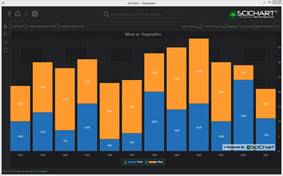
However same comment about the single data-point might cause some problems.
Finally
If you expect images like the ones you posted:

For this I would expect to see three StackedColumnRenderableSeries, each StackedColumnRenderableSeries has the same GroupId, and a number of data-points in each series
and for this

I would expect to see just a normal column series, or one StackedColumnRenderableSeries with a number of data-points.


- Andrew Burnett-Thompson answered 4 years ago
- You must login to post comments
Thanks for the clarification!
I got temperatures to look right but gases are grouped side by side instead of on top of each other. I’ll keep tweaking.
- Greg Knox answered 4 years ago
- You must login to post comments
Please login first to submit.
