Hello,
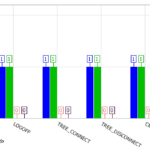
I am using StackedColumnRenderableSeries and I need annotations like in Histogram example:

    private void Window_Loaded(object sender, RoutedEventArgs e)
    {
        var brushes = new Brush[] { Brushes.Red, Brushes.Green, Brushes.Blue, Brushes.Cyan, Brushes.Gray };
        var groups = new string[] { "Group 1", "Group 2", "Group 3" };
        var datas = new Dictionary<int, double[]>()
        {
            {1, new double[]{5.0, 4.0, 3.0, 2.0, 1.0}},
            {2, new double[]{1.0, 2.0, 3.0, 2.0, 1.0}},
            {3, new double[]{1.0, 2.0, 3.0, 4.0, 5.0}}
        };
        var data = new XyDataSeries<int, double>[brushes.Length];
        for (int i = 0; i < brushes.Length; i++)
        {
            data[i] = new XyDataSeries<int, double>();
        }
        foreach (var pair in datas)
        {
            for (int i = 0; i < pair.Value.Length; i++)
            {
                data[i].Append(pair.Key, pair.Value[i]);
            }
        }

        for (int i = 0; i < brushes.Length; i++)
        {
            var renderableSeries = new StackedColumnRenderableSeries()
            {
                Fill = brushes[i],
                DataSeries = data[i],
                StackedGroupId = brushes[i].ToString(),
            };
            sciChart.RenderableSeries.Add(renderableSeries);
        }
    }
How I can add annotation for each stacked grouped column? I attached the example with my Side-By-Side chart.
Ideally, I expected the annotations to be like in attached image.
- Ivan Voyager asked 8 years ago
- last edited 8 years ago
- You must login to post comments
Hi Ivan,
Thanks for your question. As to how make labels to appear on the top of every column, it isn’t possible out of the box. However, you could use Annotations for this. To calculate coordinates for them, try to call the AccumulateYValueAtX(IRendrableSeries, Index) method, provided by StackedColumnRenderableSeries.Wrapper. You will need to do this for every index of every series. Please take a look at this thread for more info:
http://www.scichart.com/questions/question/position-columns-between-data-values-for-stacked-series
Hope this helps!
Best regards,
Yuriy
- Yuriy Zadereckiy answered 8 years ago
- You must login to post comments
Please login first to submit.

