I currently catch the MouseLeftButtonDown event like this:
<s:SciChartSurface
                    s:SciChartGroup.VerticalChartGroup="SharedChartGroup"
                    MouseLeftButtonDown="UIElement_OnMouseLeftButtonDown"
                    SeriesSource="{Binding ChartSeriesViewModels}">
But the event only fires when I click outside the chart area in an empty area (where the title goes). How can I modify the code so that the event fires when I click anywhere on the surface on the chart?
Also, how can I determine on which chartsurface the mouse click occurred?
- bbmat asked 9 years ago
- last edited 9 years ago
- You must login to post comments
Hi there,
There is a caveat in WPF itself known as how Routed Events are processed and handled:
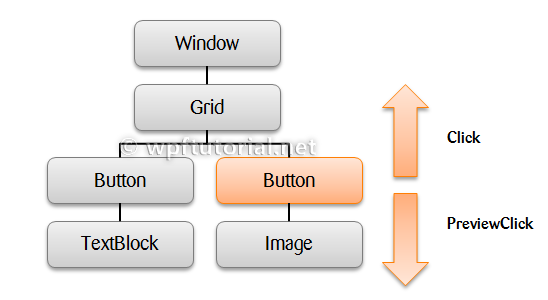
Image from here
Routed events are events which navigate up or down the visual tree according to their RoutingStrategy. The routing strategy can be bubble, tunnel or direct …
Routed events normally appear as pair. The first is a tunneling event called PreviewMouseDown and the second is the bubbling called MouseDown. They don’t stop routing if the reach an event handler. To stop routing then you have to set e.Handled = true;
In SciChart, the chart modifiers (RubberBandXyZoom, ZoomPan etc…) handle MouseLeftButtonDown, and set e.Handled=true when an event is consumed (only when an action occurs). There are several ways to work around this:
-
Declare PreviewMouseLeftButtonDown not MouseLeftButtonDown. Note if you set e.Handled = true, you will prevent modifiers from working (this might be a good thing)
-
You can subscribe to an event with a flag to ensure it is always handled even if e.Handled = true
-
You can use our ChartModifier API to insert a modifier into the hierarchy of modifiers and override OnModifierMouseDown, OnModifierMouseMove, OnModifierMouseUp
Hope this helps and do tell which solution is best for you!
Best regards,
- Andrew Burnett-Thompson answered 9 years ago
 Thanks, yes, it helps. Apologize as this was surely not a SciChart specific question. This pretty much concludes my project . I ended up with a flexible chart (time series) library that is capable of automatically detecting input data and rendering Line, Scatter, Candlestick, and OHLC series based on input data, switching between different series types, flexible pane handling and manipulations, series selection, series color adjustments, moving series from one pane to the other, a myriad of mouse interaction features, theme management. Let me know if this project could potentially be useful to publish here for the benefit of others. I think this very closely resembles charting needs for financial professionals.
 That sounds awesome, I'd love to see it and get a walkthrough some time. As I said to one customer - we build charts - but not applications. So the feedback we get from you about your experience using our charts is invaluable. I'm sure you had some pain points. Those would be good to hear about. I'm sure some things we could even include in our extensions to SciChart. Drop me an email to discuss!
- PS: Yes not strictly SciChart, but we do set e.Handled = true in modifiers and this is such a common WPF caveat that its good to have an FAQ about it
- You must login to post comments
Please login first to submit.
