Hi.
I need to change CustomAnnotation visual view, when property IsSelected = true.
I tried next code:
<Style x:Key="CustomAnnotationStyle" TargetType="{x:Type sc:CustomAnnotation}">
    <Setter Property="IsEditable" Value="True"/>
    <Style.Triggers>
        <Trigger Property="IsSelected" Value="True">
            <Setter Property="BorderBrush" Value="Orange"/>
            <Setter Property="BorderThickness" Value="2"/>
        </Trigger>
    </Style.Triggers>
</Style>
But it has no effect.
When I select the Annotation by mouse click, then it still have LightGreen rectangle.
In the Goal I need the Orange circle around of the Content of the Annotation.
Thanks.
- You must login to post comments
Hi Vyacheslav,
I’ve created a simple example which demonstrates the principle I was talking about in the comments.
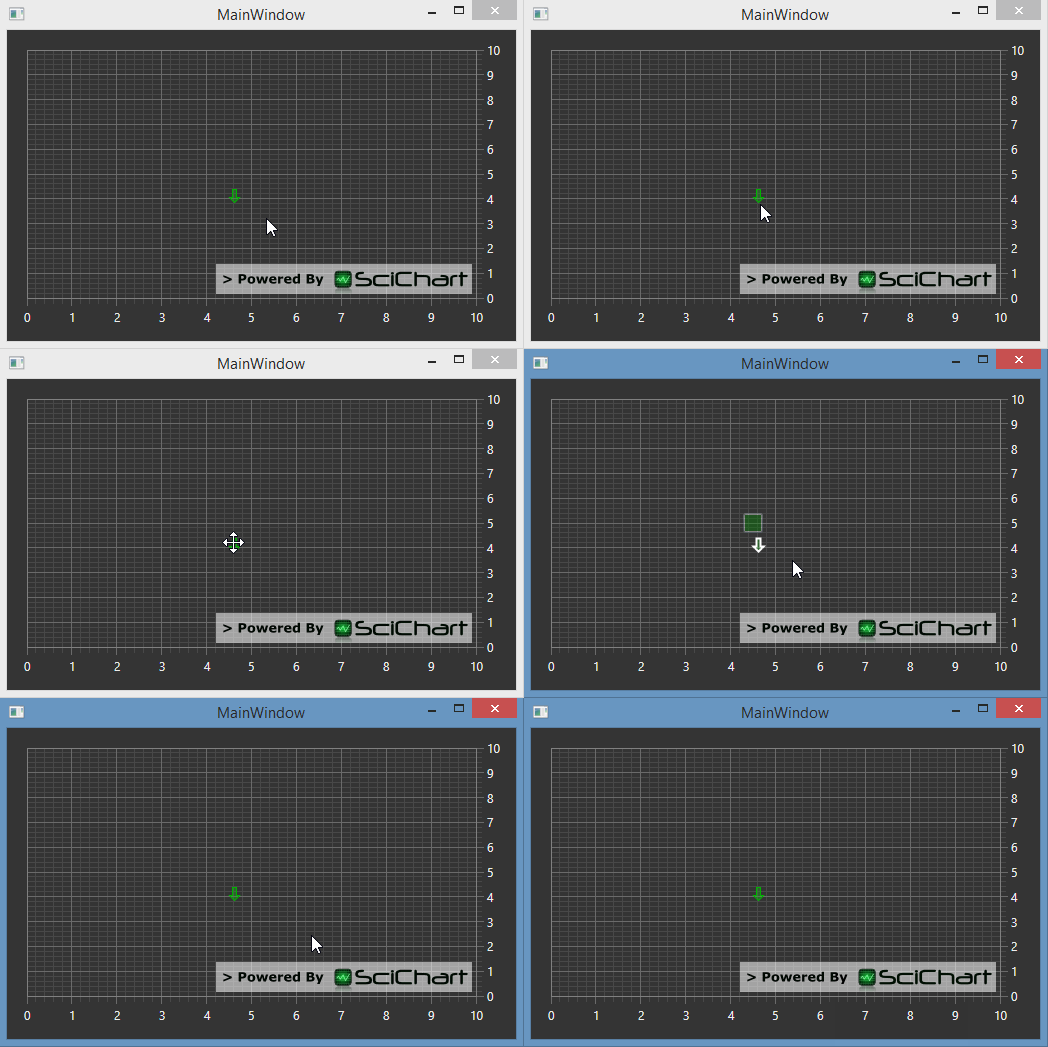
CustomAnnotation is simply a container, it has no ‘body’. The CustomAnnotation.Content is the actual visual content displayed. So, if you want to change the CustomAnnotation border or strokethickness on selection, you must change the content border or strokethickness.
Here is an example (XAML)
<Window x:Class="WpfApplication33.MainWindow"
        xmlns="http://schemas.microsoft.com/winfx/2006/xaml/presentation"
        xmlns:x="http://schemas.microsoft.com/winfx/2006/xaml"
        xmlns:s="http://schemas.abtsoftware.co.uk/scichart"
        Title="MainWindow" Height="350" Width="525">
    <Grid>
        <Grid.Resources>
            <Style x:Key="CustomAnnotationStyle" TargetType="{x:Type s:CustomAnnotation}">
                <Setter Property="IsEditable" Value="True"/>
                <Setter Property="Tag" Value="1"/>
                <Setter Property="BorderBrush" Value="#FF00B400"/>
                <Setter Property="Background" Value="#571CB61C"/>
                <Style.Triggers>
                    <Trigger Property="IsSelected" Value="True">
                        <Setter Property="BorderBrush" Value="White"/>
                        <Setter Property="Tag" Value="2"/>
                    </Trigger>
                </Style.Triggers>
            </Style>
        </Grid.Resources>
        <s:SciChartSurface>
            <s:SciChartSurface.XAxis>
                <s:NumericAxis/>
            </s:SciChartSurface.XAxis>

            <s:SciChartSurface.YAxis>
                <s:NumericAxis/>
            </s:SciChartSurface.YAxis>

            <s:SciChartSurface.Annotations>
                <s:CustomAnnotation Margin="0,15,0,0"
                                    X1="4.5"
                                    Y1="5"
                                    Style="{StaticResource CustomAnnotationStyle}">
                    <Path Data="m 3.5 0.5 4 0 0 8 3 0 -5 5 -5 -5 3 0 z"
                          Fill="{Binding Background, RelativeSource={RelativeSource FindAncestor, AncestorType=s:CustomAnnotation}}"
                          Stroke="{Binding BorderBrush, RelativeSource={RelativeSource FindAncestor, AncestorType=s:CustomAnnotation}}"
                          StrokeThickness="{Binding Tag, RelativeSource={RelativeSource FindAncestor, AncestorType=s:CustomAnnotation}}" />
                </s:CustomAnnotation>
            </s:SciChartSurface.Annotations>
        </s:SciChartSurface>
    </Grid>
</Window>
Result

- Andrew Burnett-Thompson answered 9 years ago
 Thanks. That is very helpful. I understand how it work right now .
- You must login to post comments
Please login first to submit.
